
Cricket Average Calculator
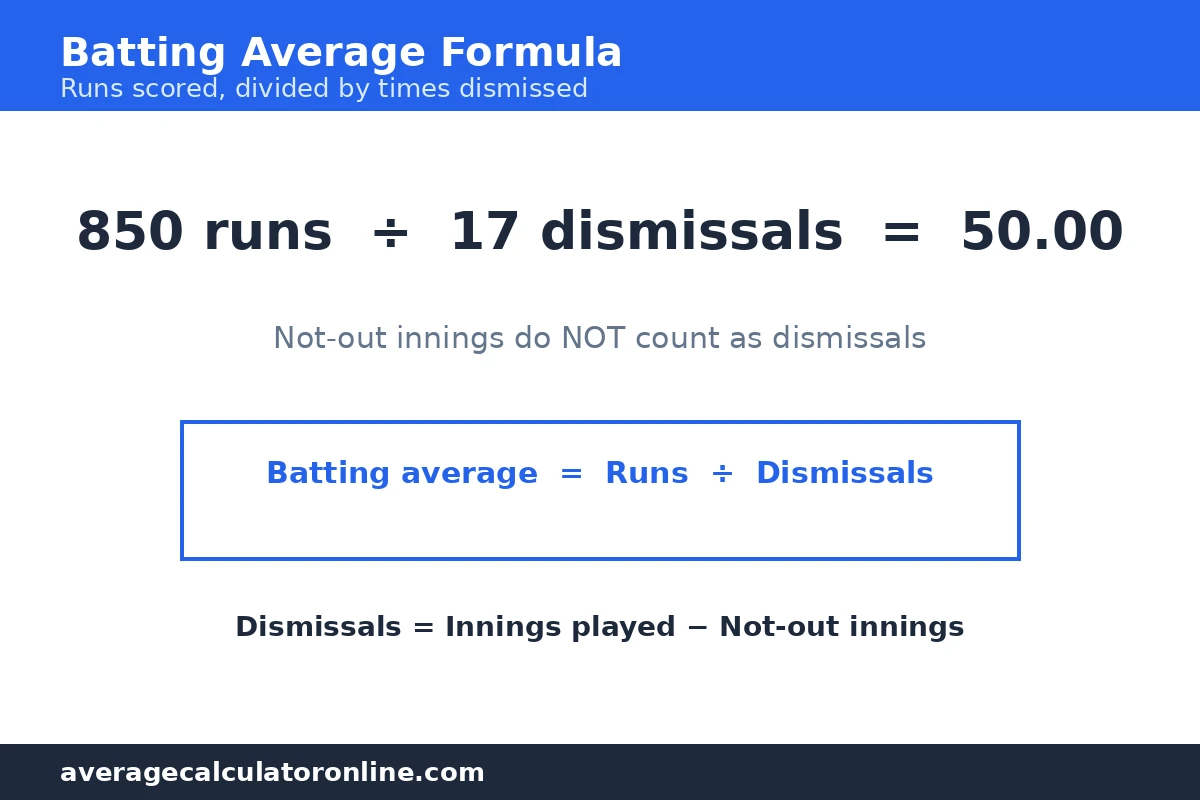
A batting average is runs scored divided by times dismissed:
Batting average = Runs ÷ Dismissals
Score 850 runs and get out 17 times and your average is 850 ÷ 17 = 50.00. A bowling average is runs conceded divided by wickets taken, and for bowlers a lower number is better: concede 612 runs for 18 wickets and the bowling average is 612 ÷ 18 = 34.00. Enter your own figures below and the tool works out both, plus strike rates.
How it works
- Pick a mode. Batting average rates a batter; bowling average rates a bowler. They are not comparable with each other — a great batting average is high, a great bowling average is low.
- Count dismissals, not innings. A batter who finishes not out was not dismissed, so those innings do not go in the denominator. Dismissals = innings played − not-out innings.
- Divide. Runs ÷ dismissals gives the batting average; runs conceded ÷ wickets gives the bowling average.
- Add strike rate for context. Batting strike rate (runs per 100 balls) rewards fast scoring; bowling strike rate (balls per wicket) rewards frequent wickets. Economy (runs per over) completes the bowling picture.
Benchmark table (rough guide, not a ranking)
| Measure | Rough guide |
|---|---|
| Batting average 50 or above | Elite — a career at this level is rare |
| Batting average 40–50 | Very good |
| Batting average 30–40 | Solid professional standard |
| Bowling average under 25 | World-class |
| Bowling average 25–30 | Very good |
| Bowling average 30–35 | Good |
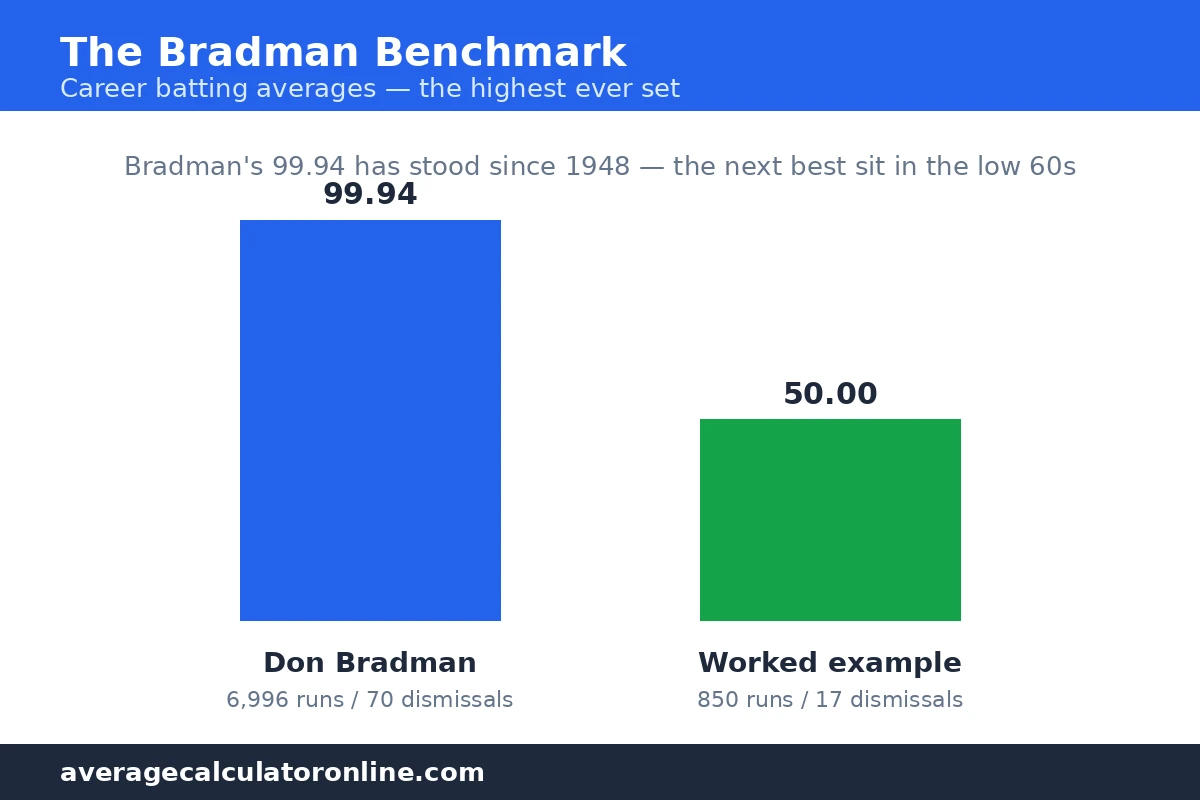
| Bradman career batting average | 99.94 (6,996 runs ÷ 70 dismissals) |
The Bradman figure is the famous outlier: his 99.94 has stood since 1948, and the next best career averages sit in the low 60s.
Worked examples
Example 1 — A strong season: batting average 50.00
Runs 850, dismissals 17.
- 850 ÷ 17 = 50.00
Example 2 — Why not-outs matter: 50.00, not 40.00
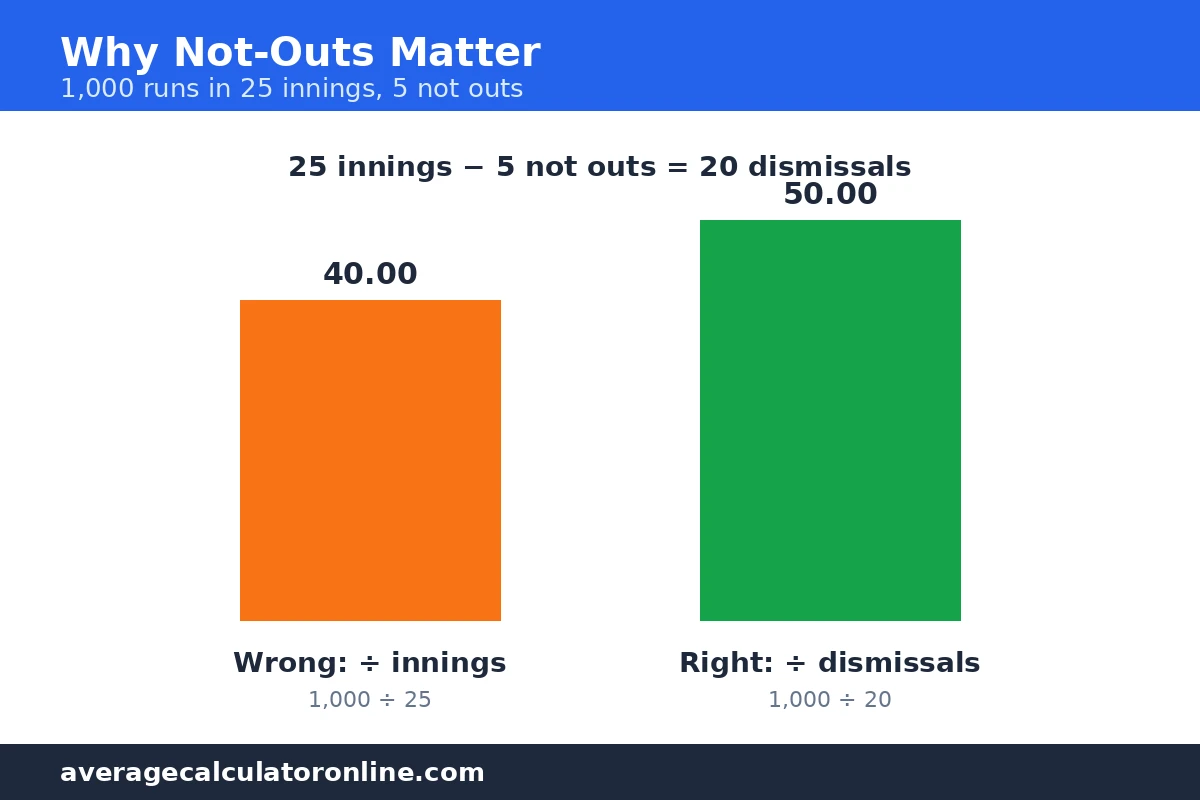
A batter scores 1,000 runs in 25 innings, finishing not out 5 times.
- Dismissals: 25 − 5 = 20
- Correct average: 1,000 ÷ 20 = 50.00
- Common mistake: 1,000 ÷ 25 = 40.00 — this wrongly counts not-out innings as dismissals and understates the average by a full 10.00 runs.
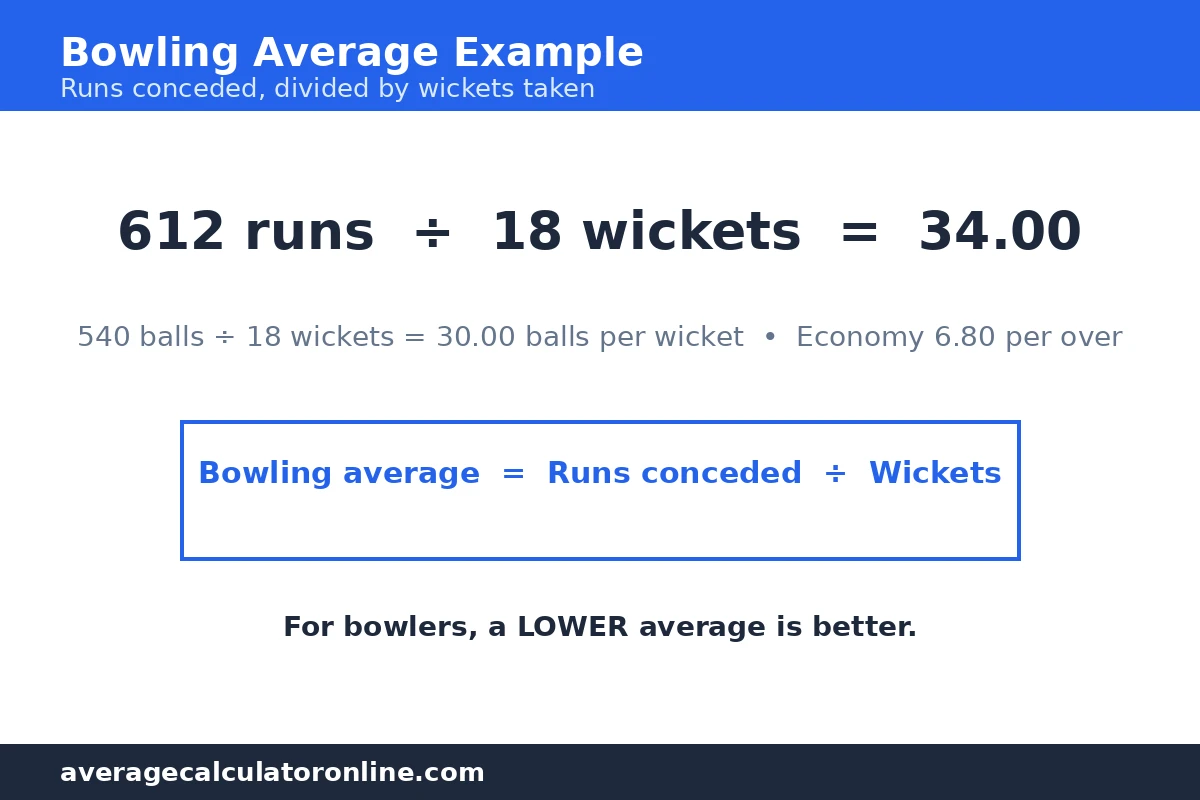
Example 3 — A bowling season: average 34.00
Runs conceded 612, wickets 18, balls bowled 540.
- Bowling average: 612 ÷ 18 = 34.00
- Bowling strike rate: 540 ÷ 18 = 30.00 balls per wicket
- Economy: 612 ÷ (540 ÷ 6) = 612 ÷ 90 = 6.80 runs per over
Example 4 — Average plus strike rate: 60.00 at 133.33
A batter scores 240 runs off 180 balls and is dismissed 4 times.
- Batting average: 240 ÷ 4 = 60.00
- Batting strike rate: 240 ÷ 180 × 100 = 133.33
The two numbers answer different questions: the average says how many runs per dismissal, the strike rate says how fast those runs came.
Tips and mistakes
- Never divide by innings. The single most common error is runs ÷ innings. Always subtract not-out innings first.
- Small samples mislead. An average from 3 innings says almost nothing; the same 50.00 over 100 innings says a great deal.
- Do not compare batting and bowling averages directly. A batting average of 40 and a bowling average of 25 are both excellent — the scales run in opposite directions.
- Averages can fall even when you score. A batter on 2,400 runs ÷ 60 dismissals = 40.00 who is then out for 0 moves to 2,400 ÷ 61 = 39.34. Every dismissal without runs pulls the average down.
- An unbeaten innings lifts the average without adding a dismissal. A batter on 2,400 runs ÷ 60 dismissals = 40.00 who then scores 100 not out moves to 2,500 ÷ 60 = 41.67.
Frequently asked questions
How is a batting average calculated?
Divide runs scored by times dismissed: Batting average = Runs ÷ Dismissals. For example, 850 runs and 17 dismissals give 850 ÷ 17 = 50.00.
Why do not-out innings not count as dismissals?
Because the batter was not dismissed in those innings. Counting them would punish a batter for finishing unbeaten: 1,000 runs in 25 innings with 5 not outs is 1,000 ÷ 20 = 50.00, not 1,000 ÷ 25 = 40.00.
What is a good batting average?
As a rough guide, 50 or above is elite, 40–50 is very good, and 30–40 is a solid professional standard. Don Bradman’s career average of 99.94 (6,996 runs ÷ 70 dismissals) stands far above every other career figure.
How is a bowling average calculated, and is lower better?
Divide runs conceded by wickets taken: Bowling average = Runs conceded ÷ Wickets. For example, 612 runs for 18 wickets is 612 ÷ 18 = 34.00. Yes — for bowlers a lower average is better, because it means fewer runs given away per wicket.
What is the difference between batting average and strike rate?
Batting average is runs per dismissal (850 ÷ 17 = 50.00); batting strike rate is runs per 100 balls (240 ÷ 180 × 100 = 133.33). Average measures consistency, strike rate measures scoring speed — a batter can be high in one and modest in the other.
Can a batting average go down even when the batter scores runs?
Yes, if the batter is dismissed cheaply. A batter on 2,400 runs ÷ 60 dismissals = 40.00 who is out for 0 moves to 2,400 ÷ 61 = 39.34. Conversely, an unbeaten innings adds runs without adding a dismissal, so it always lifts the average.
Disclaimer
Averages describe past performance only; they do not predict future results. Career benchmarks are rough guides, not selection standards, and short samples (a handful of innings) can mislead. This page is a statistics aid, not coaching or professional advice.
Related calculators
- Average Calculator Online — the homepage average tool, the same “total ÷ count” idea in its simplest form
- Grade Calculator — class averages, the closest cousin of a batting average
- Percentage Calculator — percentage change between two averages
- Car Payment Calculator — a different kind of average over time (monthly payments), for readers comparing calculator types
Last updated: November 3, 2026.