
Graphing Calculator
Intersection Finder
Find where two functions meet — the shared points solve f(x) = g(x). Both curves are drawn on the same graph.
(2.0000, 3.0000)
Green dots mark the intersection points. f(x) is blue and g(x) is red.
Direct answer: Type a function of x — for example x^2, sin(x), or 2*x+1 — and press Plot Graph. The curve is drawn on a grid from x = −10 to 10 and y = −10 to 10, with bold axes at zero.
What to try
Lines: 2*x+1 is a straight line with slope 2 and y-intercept 1. Parabolas: x^2 opens upward; −x^2 opens downward; (x−2)^2 shifts the vertex to x = 2. Waves: sin(x) oscillates between −1 and 1. Roots: sqrt(x) exists only for x ≥ 0, so its curve starts at the origin. Steep growth: x^3 grows fast and passes through the origin.
Reading a graph
Where the curve crosses the x-axis, f(x) = 0 — those are the function’s roots. Where it crosses the y-axis (x = 0), you read the y-intercept. A curve that rises left to right is increasing; one that falls is decreasing. The steepness at any point is the slope of the tangent there.
Frequently asked questions
Is this graphing calculator free?
Yes — it runs entirely in your browser, with no download, account, or signup.
What functions can I plot?
Polynomials with ^, sin, cos, tan, sqrt, log, abs, PI and E, combined with + − × ÷ and parentheses.
Why is part of my graph missing?
Some functions are undefined in places: sqrt(x) has no real values for x below 0, and log(x) none for x at or below 0. Gaps there are correct.
How do I plot two functions?
Use the Intersection Finder above: it draws f(x) and g(x) together on one graph — f(x) in blue, g(x) in red — and marks their intersection points in green.
Does it work on mobile?
Yes — the graph scales to your screen; type the function and tap Plot Graph.
Graphing Calculator Online: A Deep Dive
A graphing calculator online turns formulas into pictures. This deep dive shows how to plot functions, read slope, find intercepts, locate where graphs intersect, and recognize the shapes of common function families — with examples you can try into the plotter above.
1. Plotting Functions: From Formula to Curve
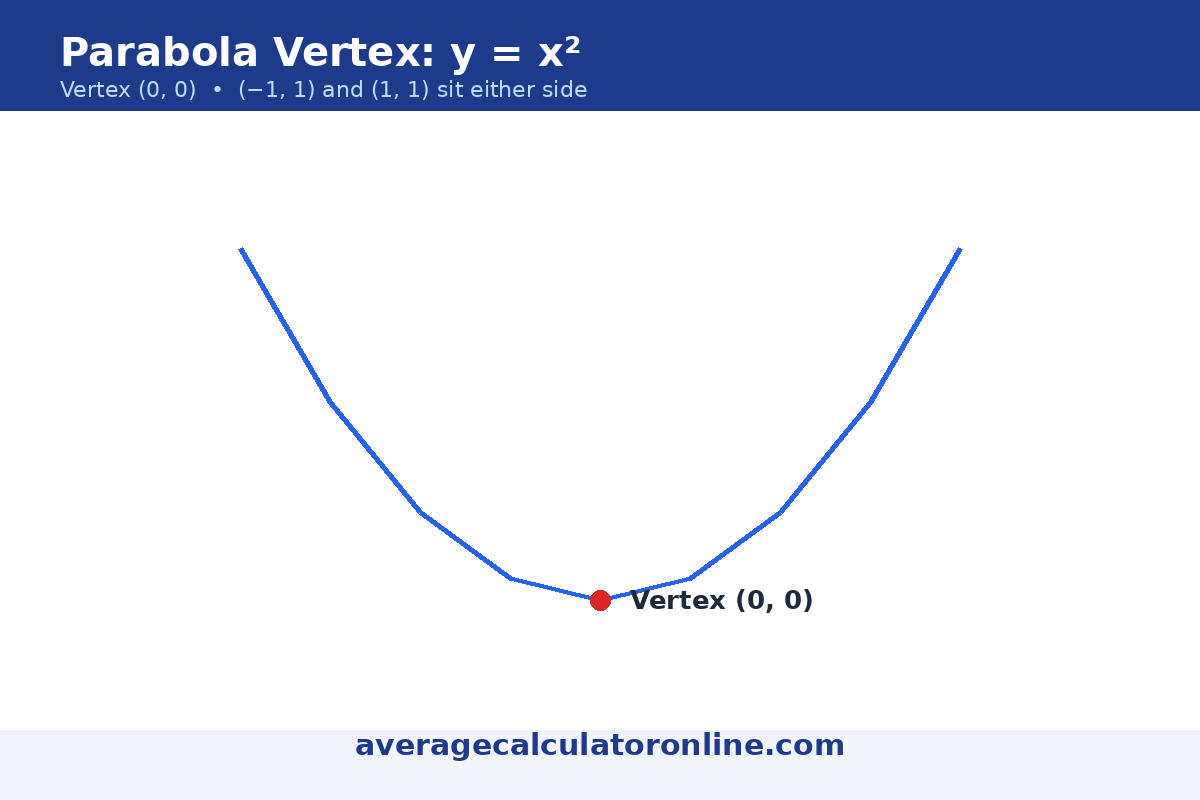
Type any function of x — try x^2, sin(x) or 2*x+1 — and press Plot Graph. The tool evaluates f(x) at hundreds of points from x = −10 to 10 and joins them into a smooth curve on a grid. A parabola like x^2 opens upward with its vertex at the origin; sin(x) waves forever; a steep line like 2*x+1 keeps one direction.

2. Slope: How Steep the Graph Is
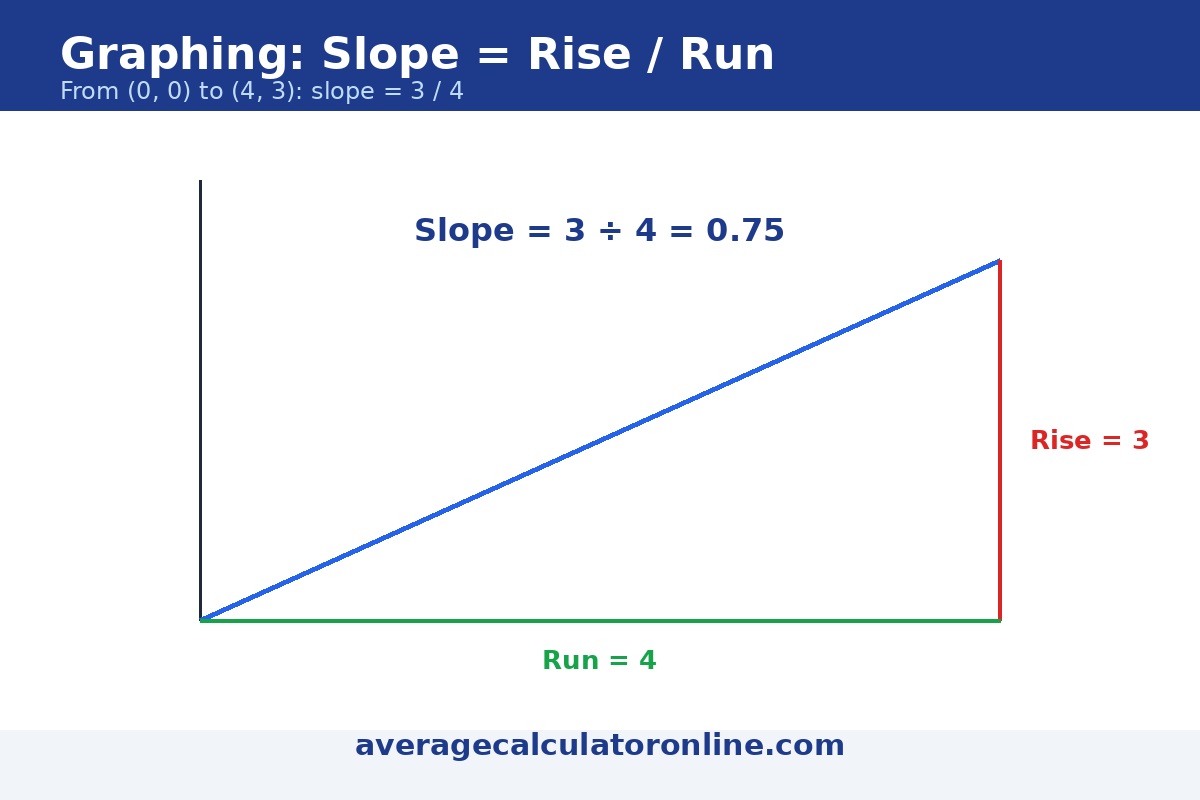
Slope is rise over run: for the line y = 2x + 1, every step right raises the graph 2 steps, so the slope is 2. A slope of 0 means a flat line, a negative slope falls to the right, and a vertical line has undefined slope. Steeper lines have larger slope: y = 3x climbs faster than y = 0.5x. On a curve like x^2, the slope itself changes — flat at the vertex, steep on the sides.
3. Intercepts and Intersection
Intercepts are where a graph crosses the axes: the y-intercept of y = 2x + 1 is (0, 1) because f(0) = 1, and its x-intercept solves 2x + 1 = 0, giving x = −0.5. An intersection is where two graphs meet — the shared point satisfies both equations. Solve 2x + 1 = −x + 4: 3x = 3, so x = 1. The lines cross at (1, 3) — plot each in the tool and check that the crossing matches.
Try it above with the Intersection Finder: enter f(x) = x+1 and g(x) = −x+5 to see the shared point (2, 3) marked in green on the graph.


4. Function Types: Recognize the Shape
Each function family has a signature shape. Linear (2x + 1) is a straight line. Quadratic (x^2) is a U-shaped parabola. Sine (sin(x)) is a repeating wave. Square root (sqrt(x)) climbs fast, then flattens — and is undefined for negative x, which is why part of its graph is missing. Spotting the family tells you what to expect before you plot.
Mistakes to Avoid When Graphing
- Plotting outside the window — the plotter shows x and y from −10 to 10; curves outside it are clipped, not wrong.
- Missing the undefined parts — sqrt(x) and log(x) have no graph for negative x; tan(x) jumps at odd multiples of π/2.
- Confusing intercept types — the y-intercept is f(0); the x-intercept solves f(x) = 0.
- Reading an intersection as a root — an intersection solves f(x) = g(x); a root solves f(x) = 0.
Last updated: November 1, 2026.