
Grade Calculator
Enter each assignment score and its weight. Weights should add up to 100.
Class Average Calculator
Enter every student’s score below — one per line. Plain numbers work (85), and so do names with scores (Anna: 85).
Pass rate (≥ 60%): 5 of 5 passed = 100.0%
Steps: sum = 433.0 ÷ 5 students = 86.6%.
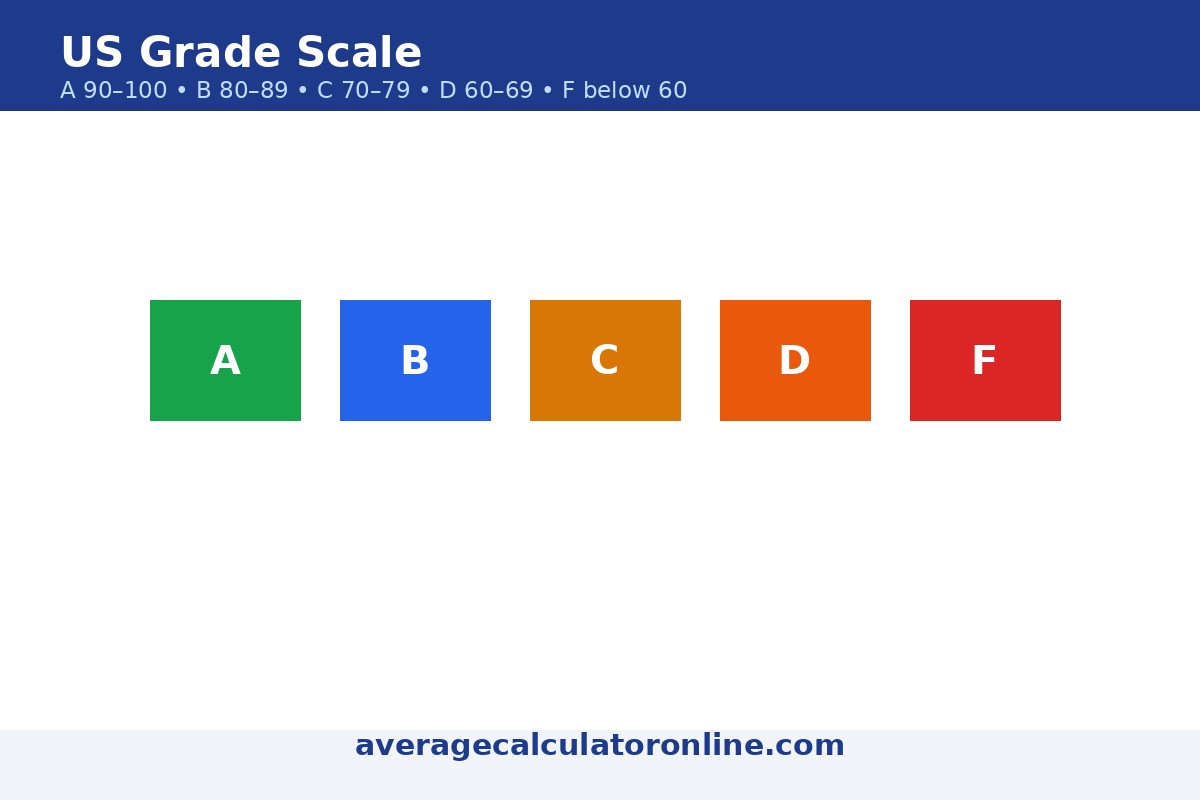
Direct answer: Overall grade = (score₁ × weight₁ + score₂ × weight₂ + …) ÷ total weight. Example: scores 85, 92 and 78 with weights 30, 40 and 30 give (85×30 + 92×40 + 78×30) ÷ 100 = 85.7% — a B. Letter grades use the standard US scale: A 90–100, B 80–89, C 70–79, D 60–69, F below 60.
Worked example
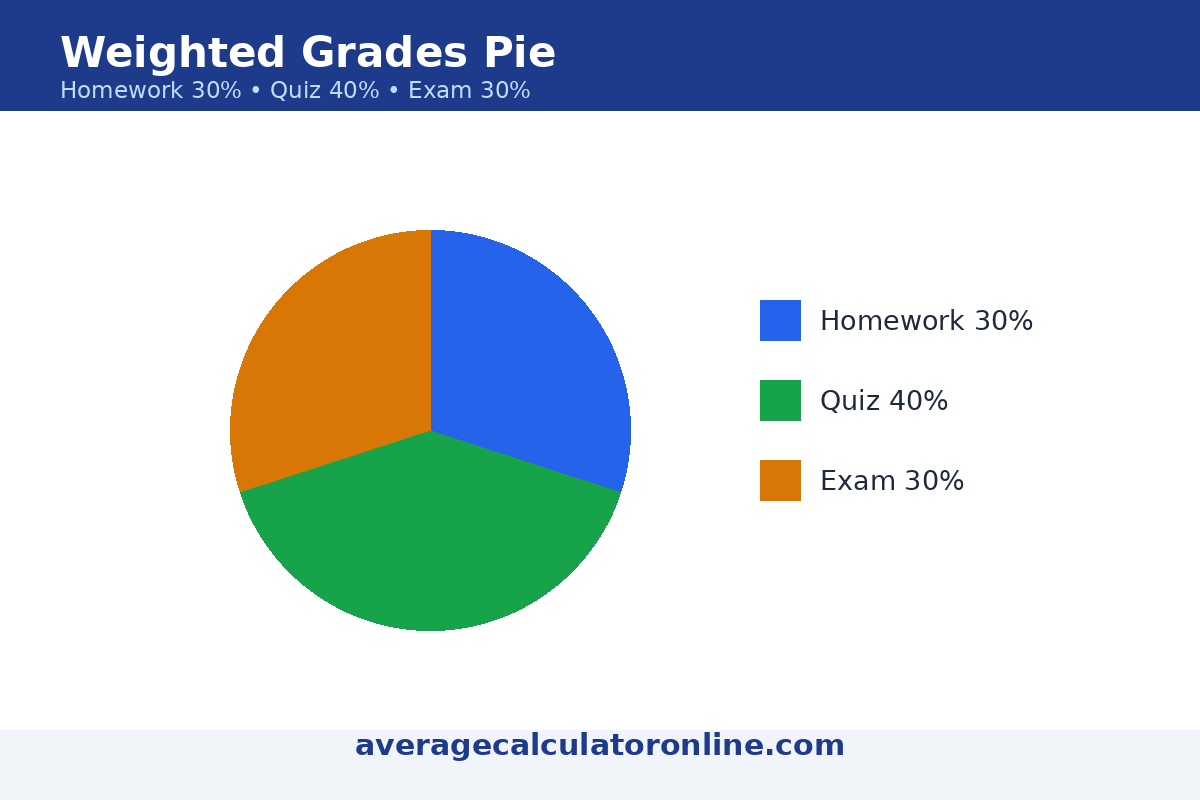
Scores 85 (weight 30), 92 (weight 40), 78 (weight 30). Overall = (85×30 + 92×40 + 78×30) ÷ 100 = (2,550 + 3,680 + 2,340) ÷ 100 = 85.7% — B.
Grade calculator vs GPA calculator vs final grade calculator
Grade calculator (this page): turns assignment scores and weights into one overall percentage and letter grade.
GPA calculator: turns letter grades and credit hours into a 4.0-scale GPA.
Final grade calculator: works backwards — it tells you what score you need on the final exam to reach a target grade. Use the tool that matches your question.
Class average
The class average is the mean of every student’s score in a class. Teachers usually report it alongside the median (the middle score), the minimum and maximum scores, the number of students, the grade distribution (how many As, Bs, Cs and so on), and the pass rate (the share of students who passed).
Worked example: five class scores are 85, 90, 78, 92 and 88. Their sum is 85 + 90 + 78 + 92 + 88 = 433, so the mean is 433 ÷ 5 = 86.6%. Sorted from lowest to highest (78, 85, 88, 90, 92), the middle value — the median — is 88.
| Grade | Score range |
|---|---|
| A | 90–100 |
| B | 80–89 |
| C | 70–79 |
| D | 60–69 |
| F | Below 60 |
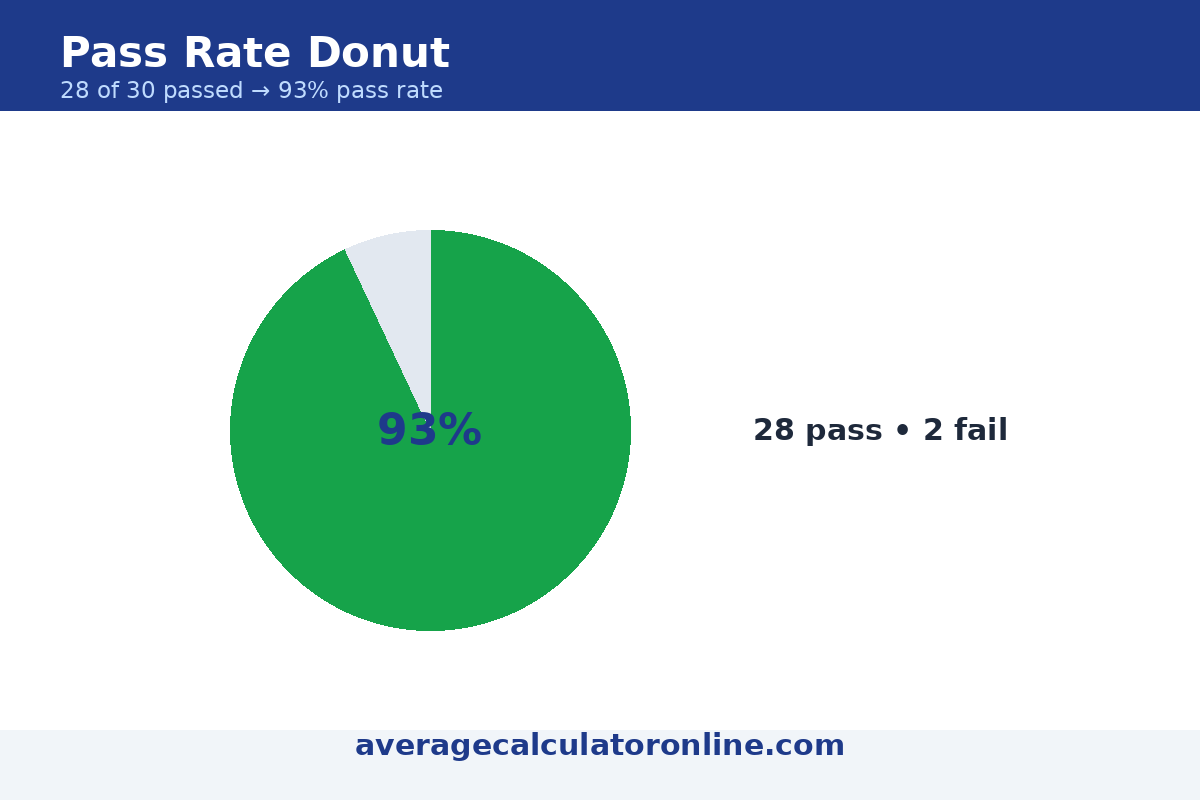
Pass rate example: if 26 out of 30 students pass, the pass rate is 26 ÷ 30 × 100 = 86.67%.
Try it above with the Class Average Calculator: paste the class scores one per line to get the mean, median, range and pass rate.
Frequently asked questions
How do I calculate my grade?
Multiply each score by its weight, add the results, and divide by the total weight. Example: 85×30 + 92×40 + 78×30, divided by 100, gives 85.7%.
What if my weights do not add up to 100?
The calculator still works: it divides by the total of the weights you entered, so the result stays correct as a weighted average.
What is a B grade in percentage?
On the standard US scale, B is 80–89%. A is 90–100%, C is 70–79%, D is 60–69%, and below 60% is F.
How do I calculate an unweighted grade?
Give every assignment the same weight. With three assignments, use 33, 33, and 34 — or simply average the scores.
Can I use points instead of percentages?
Yes, if every assignment is out of the same total. Convert points to a percentage first (points earned ÷ points possible × 100), then enter it here.
What grade do I need on the final?
That is a different question — use the final grade calculator, which solves for the required final-exam score.
What is a weighted grade?
A weighted grade is an overall grade in which each assignment counts in proportion to its weight. A final exam worth 50% influences the result five times more than homework worth 10%. This page is a grade calculator with weighted-average support: enter each score and its weight, and it returns the weighted grade and the letter grade.
What is the difference between a class average and a student grade?
A student grade is one learner’s own result. The class average is the mean of every student’s result — it describes how the group did as a whole. Comparing your grade with the class average shows whether you scored above or below the class.
How do you calculate the pass rate?
Divide the number of students who passed by the total number of students, then multiply by 100. Example: 26 passes out of 30 students gives 26 ÷ 30 × 100 = 86.67%.
Class Average: A Deep Dive
Your own grade is only half the story — the class average tells you where you stand. A class average calculator takes every student’s score and returns the mean for the whole class, so you can see whether your 85% is above or below the group.
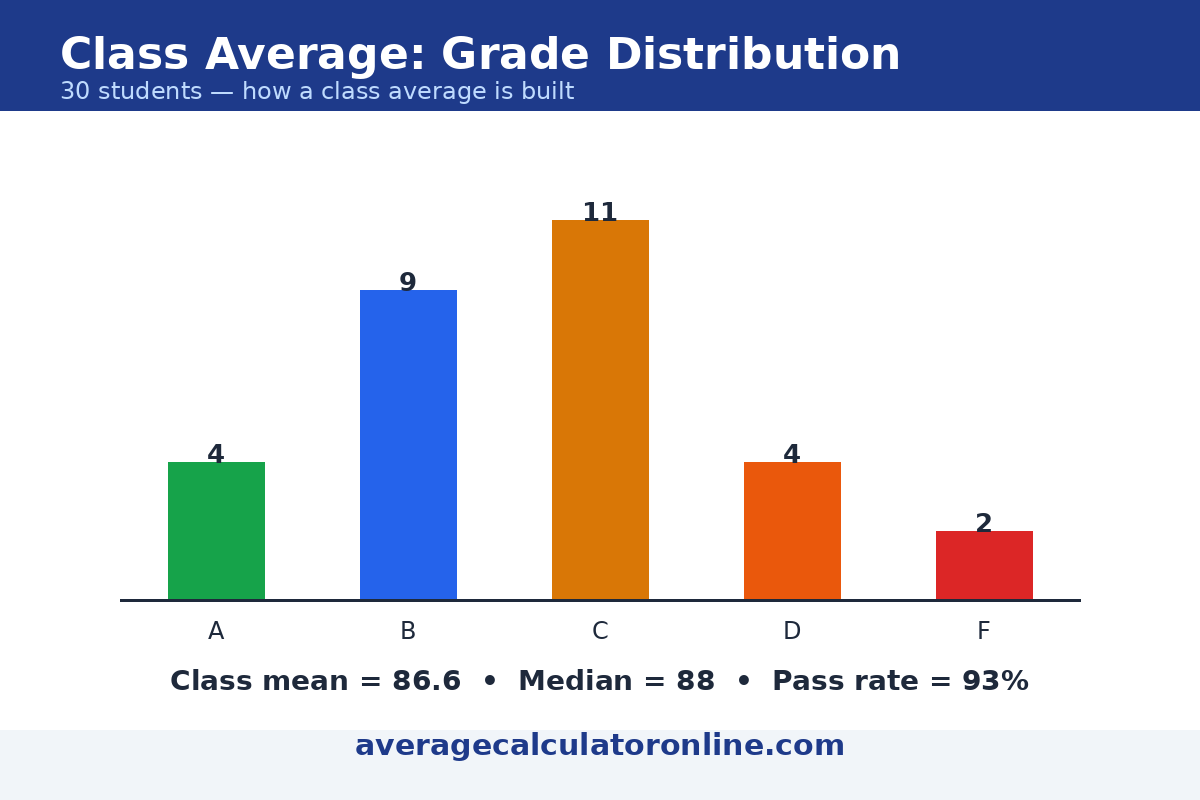
The table below shows a typical distribution for a class of 30 students. A high class average with a low pass rate is a warning sign — it means a few high scores are masking many failures, which is exactly when the median tells a truer story than the mean.
| Letter grade | Score range | Students (of 30) |
|---|---|---|
| A | 90–100 | 8 |
| B | 80–89 | 10 |
| C | 70–79 | 7 |
| D | 60–69 | 3 |
| F | Below 60 | 2 |

Last updated: November 1, 2026.