Average price per share = total amount invested ÷ total shares owned.
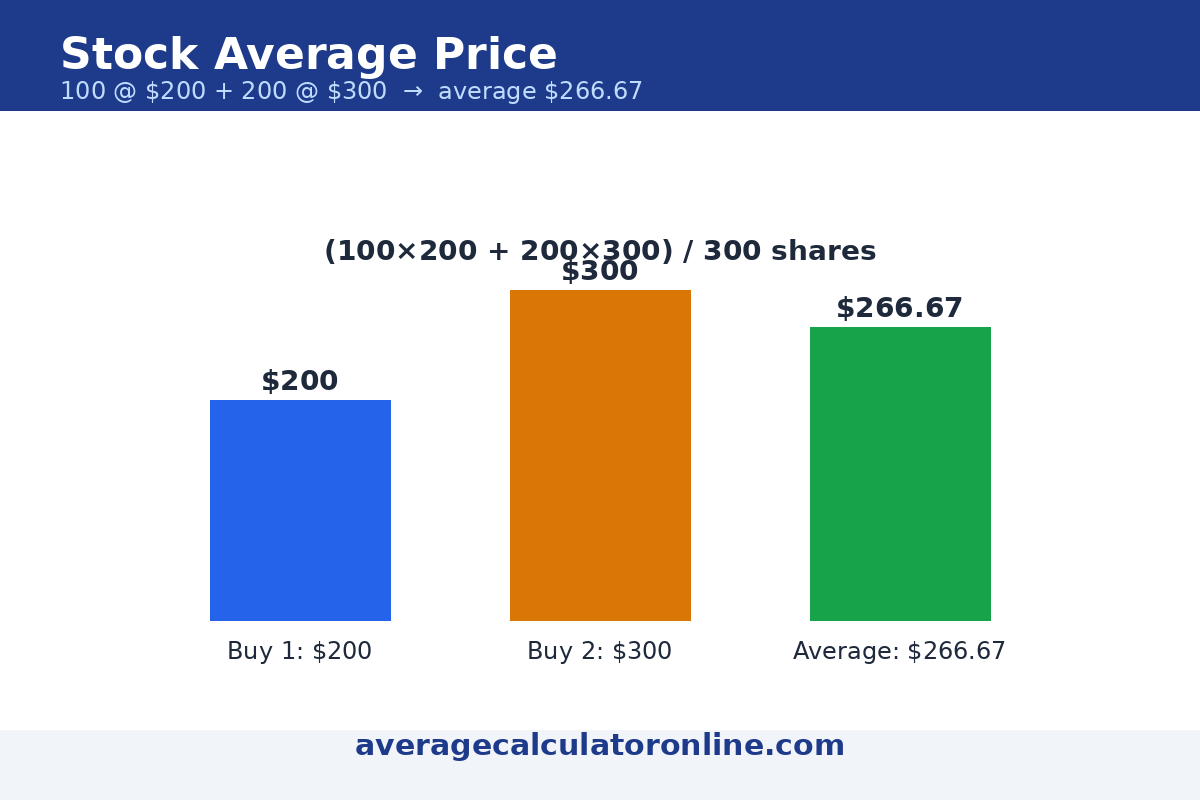
Example: 100 shares at $250 plus 200 shares at $275 = $80,000 ÷ 300 shares = $266.67 per share. The math is identical in any currency; this page uses USD first.
Stock Average Calculator (USD)
Current price per share ($) — optional, for gain/loss:
Average price: $266.67 per share
Total shares: 300 | Total invested: $80,000.00
At $300.00 per share: value $90,000.00 — gain $10,000.00 (+12.50%)
How to calculate your average stock price
- For each purchase, multiply shares by the price per share.
- Add all purchases to get the total amount invested.
- Add all shares together, then divide the total invested by the total shares.
Worked example
You buy 100 shares at $250 and later 200 shares at $275. Total invested = $25,000 + $55,000 = $80,000. Total shares = 300. Average price = $80,000 ÷ 300 = $266.67. If the price now rises to $300, your holding is worth $90,000 — a gain of $10,000 (+12.50%).

Averaging up vs averaging down
| What it means | Effect on average price | |
|---|---|---|
| Averaging down | Buying more after the price falls | Average price drops — but you own more of a falling stock |
| Averaging up | Buying more after the price rises | Average price rises — you add to a position that is working |
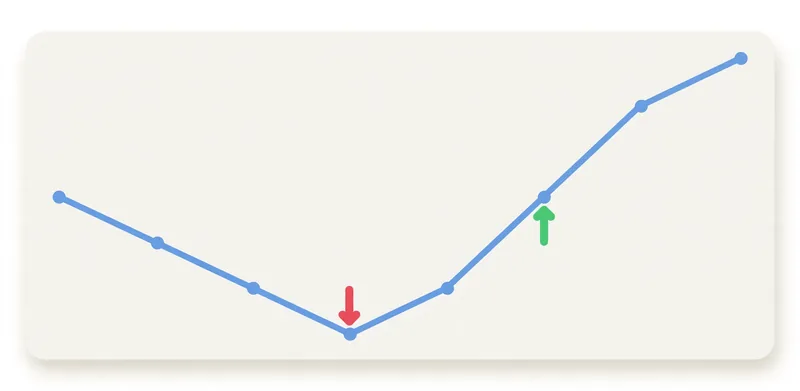
Risk of averaging down: a lower average price does not make a bad investment good. If the company’s prospects have worsened, adding money increases your loss. Never average down automatically — re-check why the price fell first.
Dollar-cost averaging
Dollar-cost averaging means investing a fixed amount at regular intervals, whatever the price. It removes the need to time the market, but it is not the same as averaging down: you are not reacting to a fall, you are following a schedule.
Charges note: this calculator excludes brokerage fees, commissions and taxes unless you add them to your purchase prices. Your broker’s cost basis may therefore differ slightly.

Break-even price
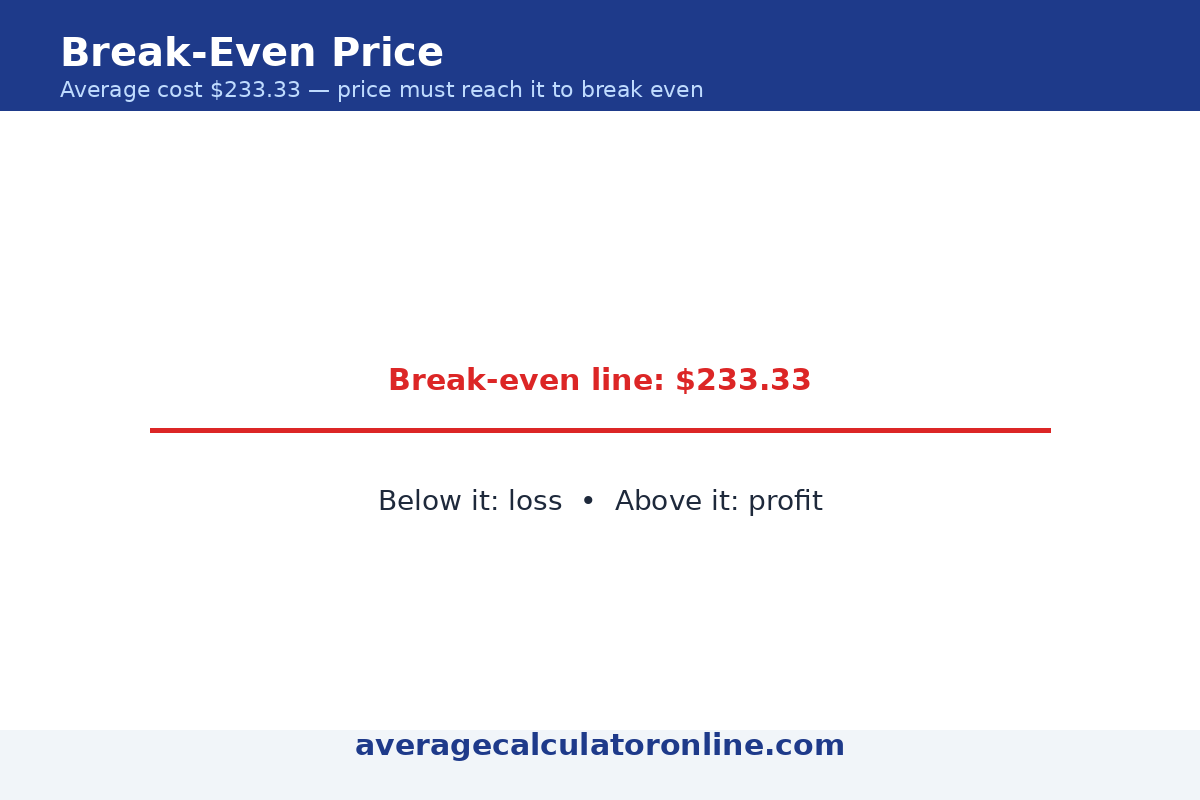
Your break-even price is the share price at which your total cost equals the total value of your holding — the price where your gain or loss is exactly zero. Without fees, it is the same number as your average price per share: sell at the break-even price and you get back exactly what you invested.
Example: if you invested $35,000 for 150 shares, your break-even price is $35,000 ÷ 150 = $233.33 per share. Selling above $233.33 locks in a profit; selling below it locks in a loss.
What happens to your average after a stock split?
A stock split does not change the total value of your investment — it only changes the number of shares and the price per share. In a 2-for-1 split, every share becomes two shares: your share count doubles and the price per share is halved, so your average cost per share is halved too.
Example: you own 100 shares with an average cost of $86 per share ($8,600 invested). After a 2-for-1 split you own 200 shares and your average becomes $86 ÷ 2 = $43 per share — still $8,600 in total. A split is cosmetic for your average: always adjust the share count, not just the price.
New average after an additional purchase
When you buy more shares, fold the new lot into your existing position with this formula:
New average = (current shares × current average + new shares × new price) ÷ total shares
Example: you hold 150 shares at an average of $233.33 ($35,000 invested) and buy 50 more shares at $260 ($13,000). New average = ($35,000 + $13,000) ÷ 200 = $48,000 ÷ 200 = $240.00 per share.
Common mistakes to avoid
- Forgetting fees: brokerage commissions and taxes raise your true cost. Add them to your purchase prices if you want your average to reflect what you actually paid.
- Ignoring stock splits: after a split, multiply your share count and divide your average price by the split ratio — otherwise your average will be wrong.
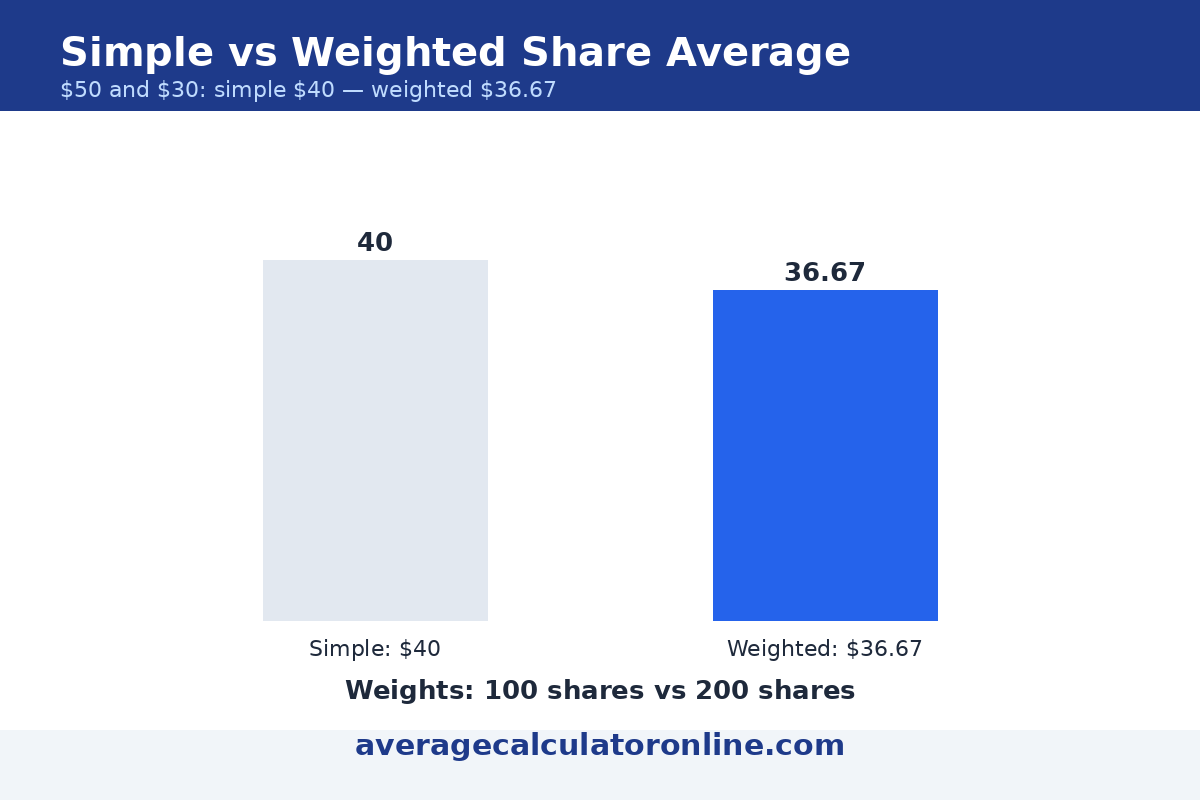
- Taking a simple average: (price 1 + price 2) ÷ 2 only works when you bought the same number of shares each time. When the share counts differ, each price must be weighted by its shares — which is exactly what this calculator does.
Key terms
- Cost basis: the total amount you paid for an investment, including purchase prices (plus any fees you choose to include). Your average price per share is your cost basis divided by your number of shares.
- Averaging down: buying more shares after the price has fallen, which lowers your average price per share.
- Averaging up: buying more shares after the price has risen, which raises your average price per share.
Frequently asked questions
What is stock averaging?
Stock averaging is working out the average price you paid per share across several purchases of the same stock: total invested divided by total shares.
What is the difference between averaging up and averaging down?
Averaging down is buying more after a fall, which lowers your average price. Averaging up is buying more after a rise, which raises it. Neither is automatically right — it depends on the stock.
Does the average price include brokerage charges and taxes?
Not in this calculator, unless you add them to your purchase prices. Brokers may include fees in their own cost-basis figure, so small differences are normal.
Can an average share price be negative?
No. Shares and prices are positive, so the average price is always positive. Only your gain or loss can be negative.
Can I average more than one stock at a time?
No — average price only makes sense per stock. Calculate each stock separately, then add the totals if you want a portfolio view.
What is the difference between dollar-cost averaging and lump-sum investing?
Dollar-cost averaging spreads a fixed amount over time; lump-sum investing puts the whole amount in at once. Averaging smooths the entry price, while a lump sum spends more time in the market.
If I sell some shares, does my average price change?
No. Selling part of a holding does not change the average price of the shares you still own — it only reduces how many shares you hold.
Does averaging down always recover a loss?
No. Averaging down only helps if the price later rises above your new average. If it keeps falling, your loss grows because you own more shares.
What happens to my average price after a stock split?
Your total invested amount stays the same; only the share count and the per-share price change. In a 2-for-1 split, your shares double and your average price per share is halved — for example, an $86 average becomes $43. A 3-for-1 split triples your shares and divides your average by three.
How do I calculate the new average after buying more shares?
Multiply your current shares by your current average, add the new shares multiplied by the new price, then divide by the total share count: (current shares × current average + new shares × new price) ÷ total shares. The calculator above does this automatically — just click “+ Add purchase” and enter the new lot.
Related calculators
Stock Average Calculator Formula: A Deep Dive
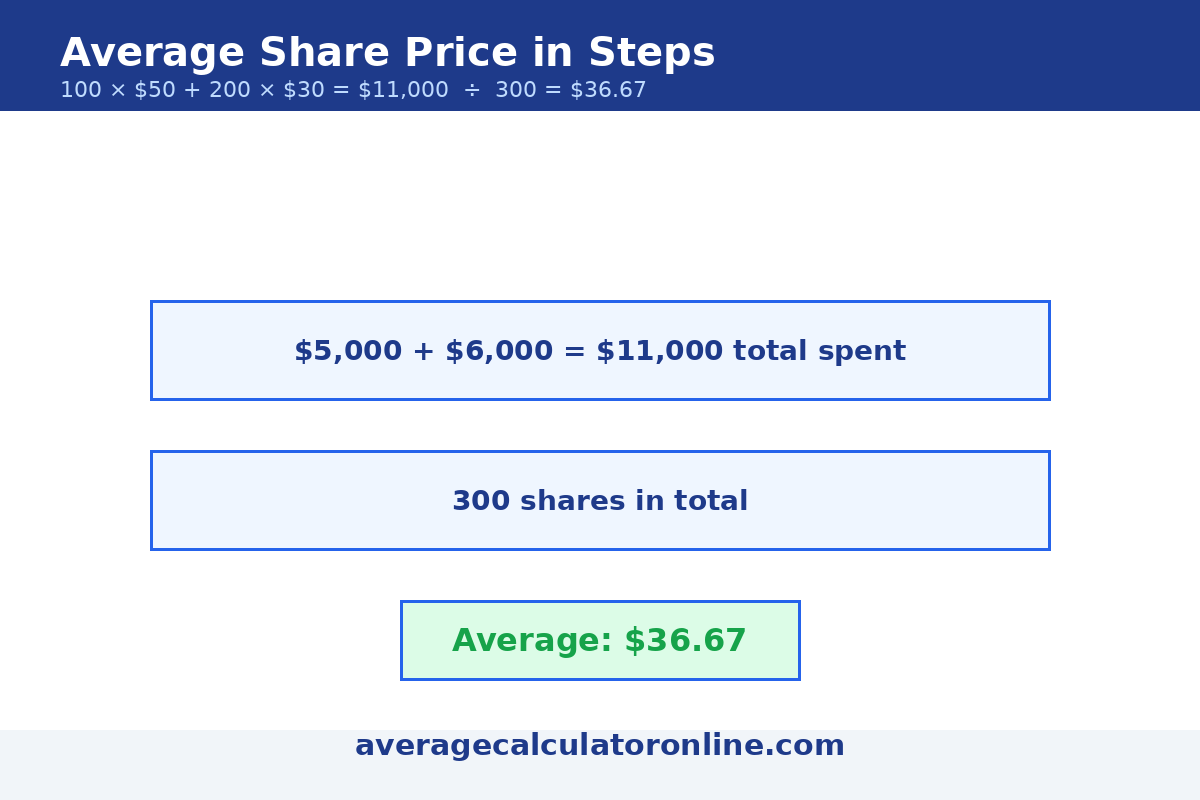
The stock average calculator formula is a weighted average computation: every share you bought counts, so a big purchase moves the average more than a small one. The figures below show why share count — not just price — decides the real average.

Disclaimer: This calculator gives estimates for planning only and is not financial advice. Figures depend on your broker’s prices, fees and taxes.
Sources & review
Learn more about investing risks from the U.S. Securities and Exchange Commission’s investor education site (investor.gov). Reviewed by the Average Calculator Team. Last reviewed: 1 November 2026. This calculator gives estimates for planning only and is not financial advice.
Last updated: November 1, 2026.