

Percentage Calculator
Direct answer: Three formulas cover nearly every percentage question: X% of Y = X ÷ 100 × Y. X as a percentage of Y = X ÷ Y × 100. Percentage change = (new – old) ÷ old × 100. See the worked examples below.
Worked examples
Example 1 — percent of: 20% of 150 = 20 ÷ 100 × 150 = 30. A 20% tip on a $150 bill is $30.
Example 2 — X as a percentage: 30 is what percent of 150? 30 ÷ 150 × 100 = 20%. You scored 30 out of 150 — that is 20%.
Example 3 — increase: Price rises from $80 to $100. Change = (100 – 80) ÷ 80 × 100 = 25% increase.
Example 4 — decrease: Price falls from $100 to $80. Change = (80 – 100) ÷ 100 × 100 = -20% (a 20% decrease). Note the base matters: up 25% then down 20% returns to the start, not to zero.
Common mistakes
The most common error is using the wrong base. “20% off $100” means $100 × 0.80 = $80, not $100 – $20% of $80. Percentage points are different from percent: rising from 20% to 25% is a 5-percentage-point rise, but a 25% relative increase.
Average of percentages
Direct answer: There are two ways to average percentages. The simple average adds up all the percentages and divides by how many there are. The weighted average multiplies each percentage by its weight (sample size), adds those products, and divides by the total weight.
Formulas: simple average P̄ = ΣP ÷ n; weighted average P̄w = Σ(P×w) ÷ Σw.
Worked example 1 — simple average: The average of 50% and 70% is (50 + 70) ÷ 2 = 60%.
Worked example 2 — weighted average: A 50% score from 10 students and a 70% score from 30 students give (50 × 10 + 70 × 30) ÷ 40 = 2600 ÷ 40 = 65%.
| Method | When to use it | Example |
|---|---|---|
| Simple average | Every percentage carries equal weight (same sample size) | (50 + 70) ÷ 2 = 60% |
| Weighted average | Percentages come from groups of different sizes | (50 × 10 + 70 × 30) ÷ 40 = 65% |
Common mistake: A simple average of percentages with different bases or sample sizes can be misleading. Above, the simple average (60%) understates the true overall rate (65%) because the larger group scored higher.
Excel: For a simple average use =AVERAGE(range). For a weighted average use =SUMPRODUCT(weights, percentages) / SUM(weights).
Frequently asked questions
How do I calculate a percentage of a number?
Divide the percentage by 100 and multiply by the number. 20% of 150 = 0.20 × 150 = 30.
How do I find what percentage one number is of another?
Divide the first number by the second and multiply by 100. 30 ÷ 150 × 100 = 20%.
How do I calculate percentage increase?
Subtract the old value from the new value, divide by the old value, and multiply by 100. From 80 to 100 is a 25% increase.
How do I calculate a discount price?
Multiply the price by (1 – discount). A 20% discount on $100 gives $100 × 0.80 = $80.
How do I add a percentage to a number?
Multiply by (1 + percentage). Adding 20% to 150 gives 150 × 1.20 = 180.
Can the average of percentages be over 100%?
Yes. If the individual percentages are themselves over 100% — for example, growth rates of 120% and 150% — their average is also over 100%. But percentages that are shares of a single whole can never average to more than 100%.
How to Calculate Average Percentage: A Deep Dive
A percentage average calculator seems simple — add the percentages, divide by how many there are — but that shortcut is only right half the time. Learning how to calculate average percentage correctly means knowing which of the two average computation methods fits your numbers: the simple average or the weighted average. Pick the wrong one and a class average of 86% can come out as 85%.
1. The Simple Average of Percentages
The simple average treats every percentage equally. Add them up and divide by the count:
P̄ = (P₁ + P₂ + … + Pₙ) ÷ n
This is valid only when every percentage shares the same base — the same whole, the same group size, the same denominator. Three quizzes each worth 100 points with scores of 80%, 90% and 70% average to (80 + 90 + 70) ÷ 3 = 80%, because each quiz carries identical weight.

2. The Weighted Average of Percentages
When the groups behind the percentages are different sizes, each percentage must be weighted by its group size before averaging:
P̄w = (P₁×w₁ + P₂×w₂ + …) ÷ (w₁ + w₂ + …)
Worked example: Class A has 20 students averaging 80%, and Class B has 30 students averaging 90%. The plain mean (80 + 90) ÷ 2 = 85% is wrong, because Class B contributes more students. The weighted average is (80×20 + 90×30) ÷ (20 + 30) = 4300 ÷ 50 = 86% — a full point higher.
3. Seeing Percentages as Parts of a Whole
A pie chart is the natural picture of percentages: every slice is a share of one whole, and the slices always add to 100%. This view also clears up the most abused distinction in percentage talk — percentage points vs percent change. A rate rising from 20% to 25% grows by 5 percentage points, but the relative increase is 5 ÷ 20 = 25%. Saying it “rose 5%” would mean 20% × 1.05 = 21%, a very different claim.

4. Simple vs Weighted: How to Choose
Use this decision rule every time you average percentages:
- Simple average — every percentage comes from the same base: the same test total, the same group size, the same time period.
- Weighted average — the percentages come from different bases: different class sizes, different sales volumes, different sample counts.
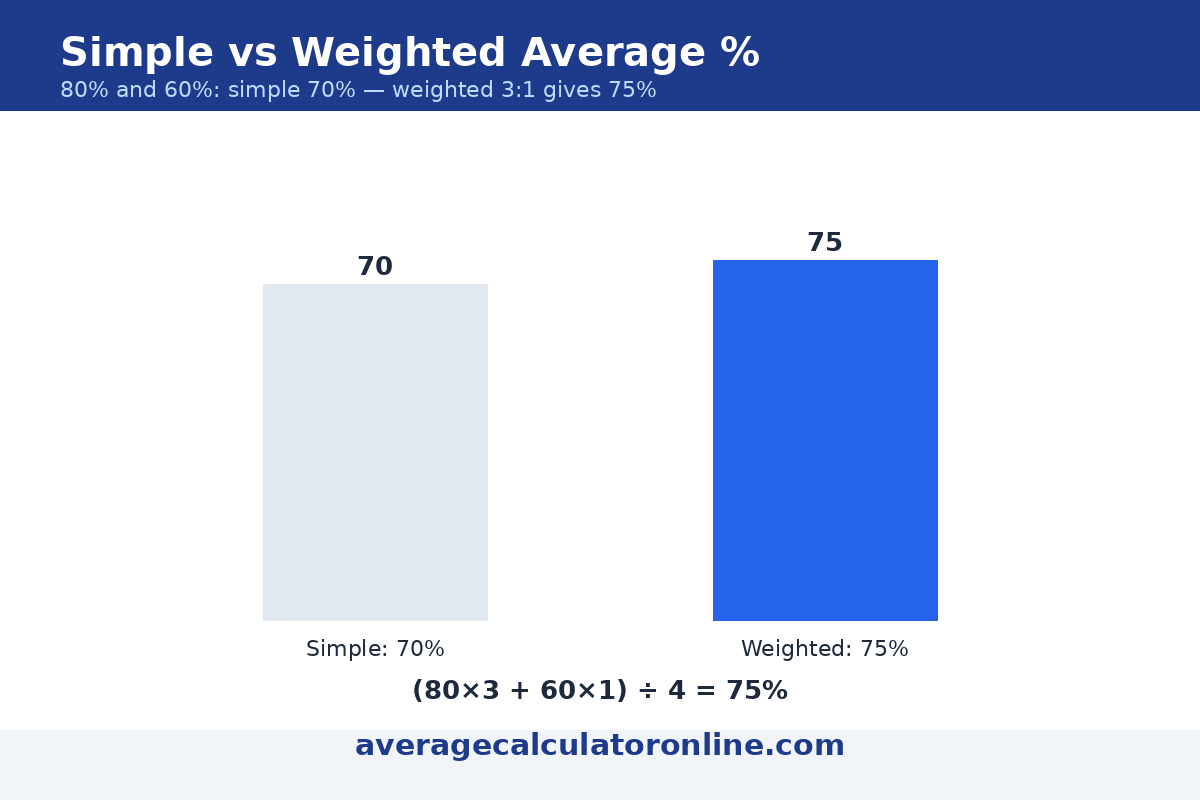
The chart below shows both answers for the two-class example. The simple average pretends both classes are equal; the weighted average respects reality.

Common Mistakes When Averaging Percentages
- Averaging percentages with different bases — 50% of 10 students and 70% of 30 students do not average to 60%. Weight them: (50×10 + 70×30) ÷ 40 = 65%.
- Confusing percentage points with percent change — a rise from 20% to 25% is 5 percentage points but a 25% relative increase.
- Averaging already-averaged percentages — averaging two monthly averages without weighting by each month’s volume silently distorts the result.
- Expecting the average to stay under 100% — if the inputs can exceed 100% (growth rates, for example), so can their average.
Last updated: November 1, 2026.