
Running Average Calculator
Direct answer
A running average is an average that updates as each new value arrives, so you can watch the average move point by point instead of waiting for the whole dataset:
Cumulative average at point n = (sum of the first n values) ÷ n · SMA(window w) at point n = average of the last w values · EMA: EMA₁ = value₁, EMAₙ = α × valueₙ + (1 − α) × EMAₙ₋₁
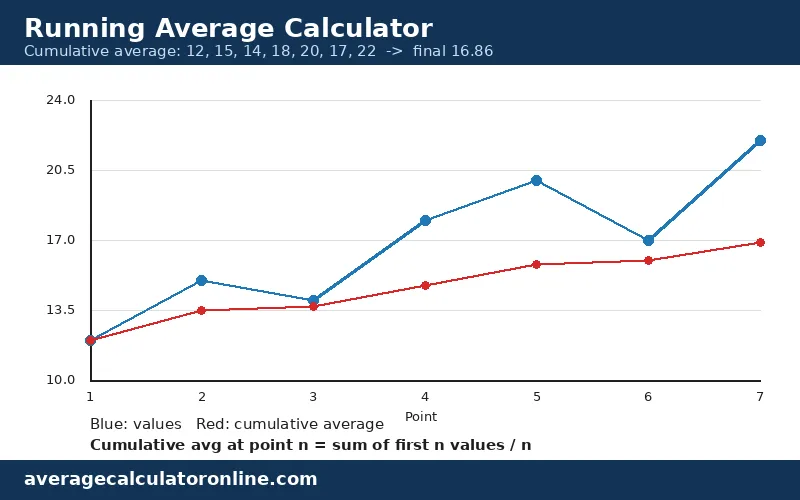
For the default dataset 12, 15, 14, 18, 20, 17, 22: the cumulative running average moves 12.00, 13.50, 13.67, 14.75, 15.80, 16.00 and ends at 16.86; the SMA(3) ends at 19.67; the EMA with alpha 0.5 ends at 19.73. Enter your own numbers below and the tool computes all three modes, shows a per-point table, and draws a live chart.
Running Average Calculator
Inputs
| Field | Default |
|---|---|
| Numbers (comma or space separated) | 12, 15, 14, 18, 20, 17, 22 |
| Mode | Cumulative running average |
| SMA window | 3 |
| EMA smoothing factor (alpha) | 0.5 |
| Upload a .txt / .csv file of numbers | — (optional; file only, no pictures) |
| Preset buttons | Default example / Preset A: 5, 10, 15 / Preset B: 100, 102, 101, 105 |
Outputs
| Output | Formula | Default result |
|---|---|---|
| Count | Number of values | 7 |
| Sum | 12 + 15 + 14 + 18 + 20 + 17 + 22 | 118.00 |
| Minimum / Maximum | Smallest / largest | 12.00 / 22.00 |
| Final cumulative average | Sum ÷ Count | 16.86 |
| Cumulative series | Running sum ÷ point number | 12.00, 13.50, 13.67, 14.75, 15.80, 16.00, 16.86 |
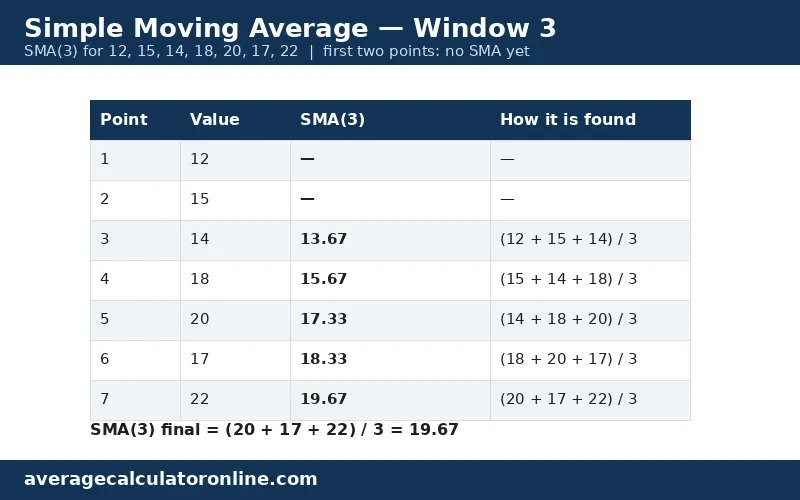
| SMA(3) series | Average of last 3 values | —, —, 13.67, 15.67, 17.33, 18.33, 19.67 |
| SMA(5) final | Average of last 5 values | 18.20 |
| SMA(7) final | Average of all 7 values | 16.86 |
| SMA(10) | Window longer than dataset | All — |
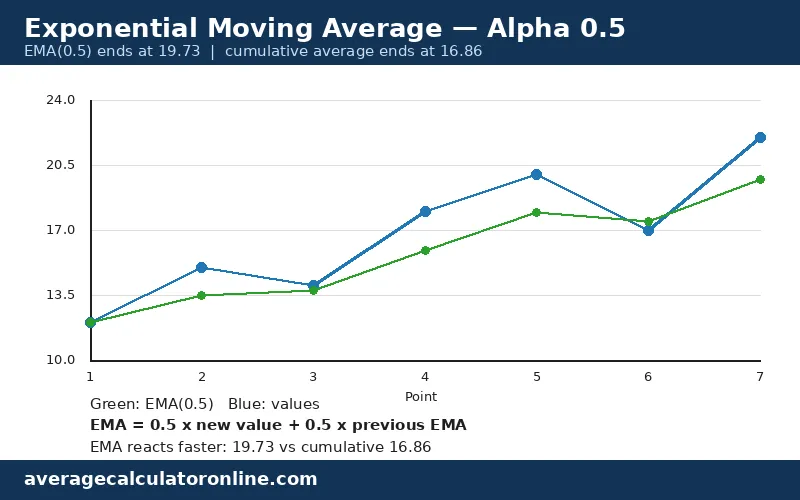
| EMA(0.5) series | α × value + (1 − α) × previous EMA | 12.00, 13.50, 13.75, 15.88, 17.94, 17.47, 19.73 |
| EMA(0.3) final | α = 0.3 | 18.14 |
| EMA(0.2) final | α = 0.2 | 16.80 |
| Live chart | Canvas line chart, values vs selected mode’s average | Values (blue) vs average (red), axes labelled, legend |
Defaults on load: 12, 15, 14, 18, 20, 17, 22 → final cumulative average 16.86, SMA(3) final 19.67, EMA(0.5) final 19.73, count 7, sum 118. The tool must show these results before the visitor types anything, and must recalculate on every input change. At least two numbers are required; non-numeric entries are ignored and noted; a window larger than the dataset shows “—” for early points, never NaN or Infinity.
How it works
- Cumulative running average. Add the values up to each point and divide by how many values there are so far. At point n: cumulative average = (sum of the first n values) ÷ n. For the default dataset: point 1 is 12 ÷ 1 = 12.00; point 2 is (12 + 15) ÷ 2 = 27 ÷ 2 = 13.50; point 3 is 41 ÷ 3 = 13.67; point 4 is 59 ÷ 4 = 14.75; point 5 is 79 ÷ 5 = 15.80; point 6 is 96 ÷ 6 = 16.00; point 7 is 118 ÷ 7 = 16.86. Every value counts equally, so early values keep influencing the average for a long time.
- Simple moving average (SMA). Take only the last w values and average them. SMA(window w) at point n = average of values n − w + 1 through n. With window 3 on the default dataset there is no SMA for points 1 and 2 (fewer than 3 values exist), then: point 3 is (12 + 15 + 14) ÷ 3 = 13.67; point 4 is (15 + 14 + 18) ÷ 3 = 15.67; point 5 is (14 + 18 + 20) ÷ 3 = 17.33; point 6 is (18 + 20 + 17) ÷ 3 = 18.33; point 7 is (20 + 17 + 22) ÷ 3 = 19.67. A short window reacts fast; a long window is smoother.
- Exponential moving average (EMA). Start with the first value, then blend each new value with the previous EMA: EMAₙ = α × valueₙ + (1 − α) × EMAₙ₋₁. With alpha 0.5 on the default dataset: EMA₁ = 12.00; EMA₂ = 0.5 × 15 + 0.5 × 12 = 13.50; EMA₃ = 0.5 × 14 + 0.5 × 13.50 = 13.75; EMA₄ = 0.5 × 18 + 0.5 × 13.75 = 15.88; EMA₅ = 0.5 × 20 + 0.5 × 15.88 = 17.94; EMA₆ = 0.5 × 17 + 0.5 × 17.94 = 17.47; EMA₇ = 0.5 × 22 + 0.5 × 17.47 = 19.73. Unlike SMA, EMA never drops old values entirely — their weight just fades.
- Reading the chart. The blue line is your raw values; the red line is the selected mode’s average. When the red line sits below the blue line, recent values are above the average so far; when it sits above, recent values are below it. Switch modes to compare how fast each average follows the data.
Cumulative running average, step by step (default dataset)
| Point | Value | Running sum | Cumulative average |
|---|---|---|---|
| 1 | 12 | 12 | 12.00 |
| 2 | 15 | 27 | 13.50 |
| 3 | 14 | 41 | 13.67 |
| 4 | 18 | 59 | 14.75 |
| 5 | 20 | 79 | 15.80 |
| 6 | 17 | 96 | 16.00 |
| 7 | 22 | 118 | 16.86 |
SMA window comparison (default dataset, final values)
| Window | Early points | Final SMA |
|---|---|---|
| 3 | —, — | 19.67 |
| 5 | —, —, —, — | 18.20 |
| 7 | —, —, —, —, —, — | 16.86 |
| 10 | all — (window longer than the dataset) | — |
The longer the window, the closer the SMA sits to the cumulative average — with window 7 it equals it exactly (16.86), because the window covers the whole dataset.
EMA alpha comparison (default dataset, final values)
| Alpha | Final EMA | Behaviour |
|---|---|---|
| 0.2 | 16.80 | Slow, smooth — close to the cumulative average |
| 0.3 | 18.14 | Medium response |
| 0.5 | 19.73 | Fast — follows recent values closely |
The three modes at a glance (default dataset)
| Mode | Final value | Reacts to new values | Memory |
|---|---|---|---|
| Cumulative average | 16.86 | Slowest — every past value counts equally | Whole dataset |
| SMA(3) | 19.67 | Fast — only the last 3 values | Last w values |
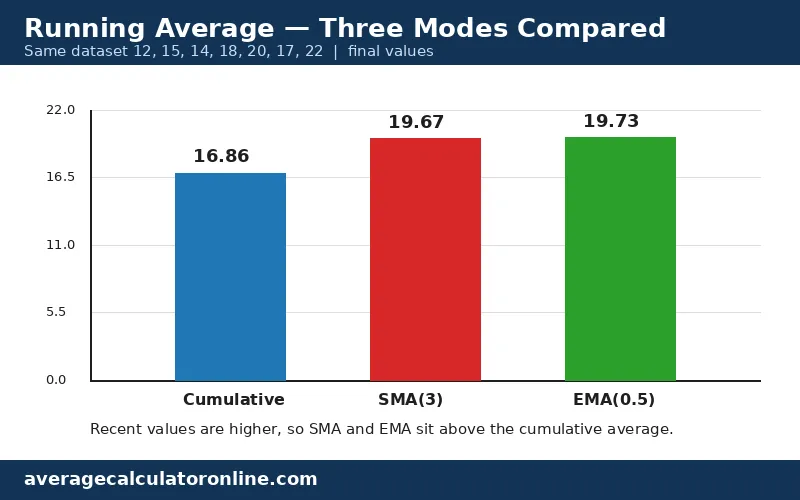
| EMA(0.5) | 19.73 | Fast — newest value gets half the weight | All values, fading weight |
Worked examples (all recomputed in node)
Example 1 — The default dataset: cumulative 16.86, SMA(3) 19.67, EMA(0.5) 19.73
Dataset 12, 15, 14, 18, 20, 17, 22.
- Sum: 12 + 15 + 14 + 18 + 20 + 17 + 22 = 118
- Count: 7; min 12; max 22
- Cumulative: 12.00, 13.50, 13.67, 14.75, 15.80, 16.00, 16.86
- SMA(3): —, —, 13.67, 15.67, 17.33, 18.33, 19.67
- SMA(5): —, —, —, —, 15.80, 16.80, 18.20
- EMA(0.5): 12.00, 13.50, 13.75, 15.88, 17.94, 17.47, 19.73
- EMA(0.3): 12.00, 12.90, 13.23, 14.66, 16.26, 16.48, 18.14
The cumulative average (16.86) is the lowest of the three finals because it still carries the early low values 12, 15 and 14; the SMA(3) and EMA(0.5) both sit near 19.7 because the recent values 20, 17 and 22 are higher.
Example 2 — Steady climb: 10, 20, 30, 40
- Sum: 10 + 20 + 30 + 40 = 100
- Cumulative: 10.00, 15.00, 20.00, 25.00
- SMA(3): —, —, 20.00, 30.00
- EMA(0.5): 10.00, 15.00, 22.50, 31.25
Every step rises by 10, so every average lags behind the newest value — the cumulative average ends at 25.00 while the latest value is 40. That lag is normal: an average of rising numbers is always below the newest number.
Example 3 — Preset A: 5, 10, 15
- Sum: 5 + 10 + 15 = 30
- Cumulative: 5.00, 7.50, 10.00
- SMA(3): —, —, 10.00 (the window covers the whole dataset, so it equals the cumulative average)
- EMA(0.5): 5.00, 7.50, 11.25
Example 4 — Preset B: 100, 102, 101, 105
- Sum: 100 + 102 + 101 + 105 = 408
- Cumulative: 100.00, 101.00, 101.00, 102.00
- SMA(3): —, —, 101.00, 102.67
- EMA(0.5): 100.00, 101.00, 101.00, 103.00
The values barely move, so all three averages stay within about one point of each other — 102.00, 102.67 and 103.00. When data is stable, the choice of mode hardly matters; it matters most when values jump around.
Tips and mistakes
- Do not pick a window longer than your dataset. With window 10 on 7 values there is no SMA at all — every point shows “—”. Use a window smaller than your count, or switch to cumulative or EMA.
- The cumulative average gets slower as data grows. After 100 values, one new value moves the cumulative average by only about 1% of its gap from the average. If you want to follow recent changes, use SMA or EMA instead.
- A higher alpha is not “more accurate”. Alpha 0.5 reacts faster than alpha 0.2, but it also jumps more with every noisy value. Match alpha to your data: 0.2–0.3 for noisy data, 0.5 for data where recent values genuinely matter more.
- SMA drops old values suddenly; EMA fades them. When a large value leaves the SMA window, the SMA can jump even though nothing new happened. EMA has no such cliff — old values just fade gradually.
- An average of rising numbers is always below the newest number. In Example 2 the values climb 10, 20, 30, 40 but the cumulative average ends at 25.00. That is not an error — it is what an average means.
- Check that non-numeric entries were ignored. If you paste “12, fifteen, 14” the tool uses 12 and 14 and tells you one entry was ignored. Fix the entry and recalculate rather than trusting a partial list.
- At least two numbers are needed. A single value has no “running” average to show — the tool asks for a second number instead of guessing.
Frequently asked questions
What is a running average?
A running average is an average that updates as each new value arrives, so you can watch the average move point by point instead of waiting for the whole dataset. For 12, 15, 14, 18, 20, 17, 22 the cumulative running average moves 12.00, 13.50, 13.67, 14.75, 15.80, 16.00 and ends at 16.86.
How do you calculate a cumulative running average?
Add the values up to each point and divide by how many values there are so far: at point n, cumulative average = sum of the first n values ÷ n. For 12, 15, 14, 18 the running sums are 12, 27, 41 and 59, so the cumulative averages are 12.00, 13.50, 13.67 and 14.75.
What is the difference between SMA and EMA?
A simple moving average (SMA) gives equal weight to each value inside its window, while an exponential moving average (EMA) gives more weight to the most recent values. For the default dataset the SMA(3) ends at 19.67 and the EMA(0.5) ends at 19.73, while the cumulative average ends at 16.86 — the SMA and EMA react faster to the recent higher values.
Which window should I choose for a simple moving average?
A short window such as 3 reacts quickly to recent changes but jumps around more, while a longer window such as 7 or 10 is smoother but slower to react. For 12, 15, 14, 18, 20, 17, 22 the SMA(3) ends at 19.67, the SMA(5) at 18.20 and the SMA(7) at 16.86; start with 3 if you want to follow recent movement, and use a longer window if you want the overall trend.
What does the smoothing factor (alpha) do in EMA?
Alpha controls how much weight the newest value gets: a higher alpha reacts faster, a lower alpha is smoother. With alpha 0.5 the EMA of the default dataset ends at 19.73, with alpha 0.3 it ends at 18.14, and with alpha 0.2 it ends at 16.80. Alpha must be between 0.01 and 0.99.
How do I paste a list or upload a file of numbers?
Paste numbers separated by commas, spaces or line breaks into the numbers box, or upload a .txt or .csv file and the tool reads the numbers from it. Non-numeric entries are ignored and noted, and at least two numbers are needed before the table and chart appear.
Disclaimer
The results on this page describe the numbers you enter — they are averages of your own data, not predictions about future values. A running average smooths past numbers; it does not forecast what comes next, and it is not financial, medical or legal advice. If you are using moving averages for trading or any financial decision, check the rules and risks of that market separately.
Related calculators
- Average Calculator Online — the homepage average tool
- Statistics Calculator — mean, median, mode and standard deviation of a finished dataset
- Math Calculator — arithmetic for hand-checking averages
- Graphing Calculator — plot functions and data on a chart
- Percentage Calculator — percentage change and proportions
Last updated: November 7, 2026.