
Statistics Calculator
Direct answer
For a set of numbers, the mean is the sum divided by the count, the median is the middle value when the numbers are sorted, and the standard deviation measures how spread out the numbers are around the mean:
Averages also decide outcomes in games — our Palworld Breeding Calculator averages two parents’ breeding power to find the offspring.
Mean = Sum ÷ Count · Median = middle value of the sorted list · Standard deviation = √(average squared deviation from the mean)
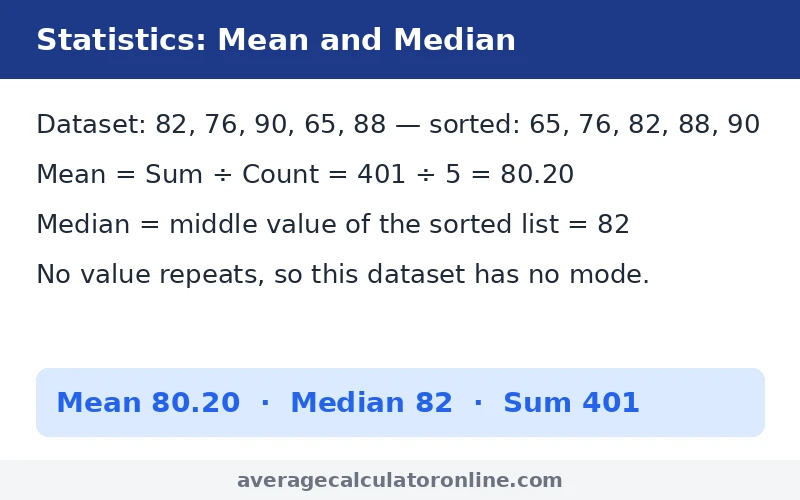
For the default dataset 82, 76, 90, 65, 88: the sum is 401, the mean is 401 ÷ 5 = 80.20, the median is 82 (the middle of 65, 76, 82, 88, 90), the range is 25 (65–90), the population standard deviation is 9.04 and the sample standard deviation is 10.11. Enter your own numbers below and the tool computes all of these for you.
Statistics Calculator
Inputs
| Field | Default |
|---|---|
| Dataset (comma-separated numbers) | 82, 76, 90, 65, 88 |
Outputs
| Output | Formula | Default result |
|---|---|---|
| Count | Number of values | 5 |
| Sum | 82 + 76 + 90 + 65 + 88 | 401.00 |
| Mean | Sum ÷ Count | 80.20 |
| Median | Middle of sorted list | 82.00 |
| Mode | Most frequent value | No mode |
| Minimum / Maximum | Smallest / largest | 65.00 / 90.00 |
| Range | Maximum − Minimum | 25.00 |
| Population variance | Sum of squared deviations ÷ n | 81.76 |
| Population standard deviation | √(population variance) | 9.04 |
| Sample variance | Sum of squared deviations ÷ (n − 1) | 102.20 |
| Sample standard deviation | √(sample variance) | 10.11 |
Defaults on load: 82, 76, 90, 65, 88 → mean 80.20, median 82, sum 401, range 25. The results show as soon as the page loads, before you enter anything. At least two numbers are required; non-numeric entries are ignored.
How it works
- Mean (average). Add all the values and divide by how many there are. Mean = Sum ÷ Count. For 82, 76, 90, 65, 88: (82 + 76 + 90 + 65 + 88) ÷ 5 = 401 ÷ 5 = 80.20. The mean uses every value, so one extreme value can pull it away from the rest.
- Median (middle value). Sort the numbers from smallest to largest and take the middle one. For 65, 76, 82, 88, 90 the middle value is 82. With an even count there is no single middle value, so take the average of the two middle values — for 4, 8, 15, 16, 23, 42 the median is (15 + 16) ÷ 2 = 15.50.
- Mode (most frequent value). The value that appears most often. For 3, 5, 5, 7, 9 the mode is 5 (it appears twice). A dataset can have more than one mode, or no mode at all — the default dataset has no repeated value, so it has no mode.
- Range. Maximum minus minimum: 90 − 65 = 25 for the default dataset. It is the simplest measure of spread, but it only looks at the two extreme values.
- Variance. The average of the squared differences from the mean. Square each value’s distance from the mean, add them up, and divide. For the default dataset the squared deviations add to 408.80 (see the table below).
- Standard deviation. The square root of the variance. It is in the same units as the original numbers, so it is easier to read than variance: a standard deviation of 9.04 means a typical value sits about 9 points from the mean of 80.20.
Population vs sample — which formula, and when
There are two versions of variance and standard deviation, and they differ only in the divisor:
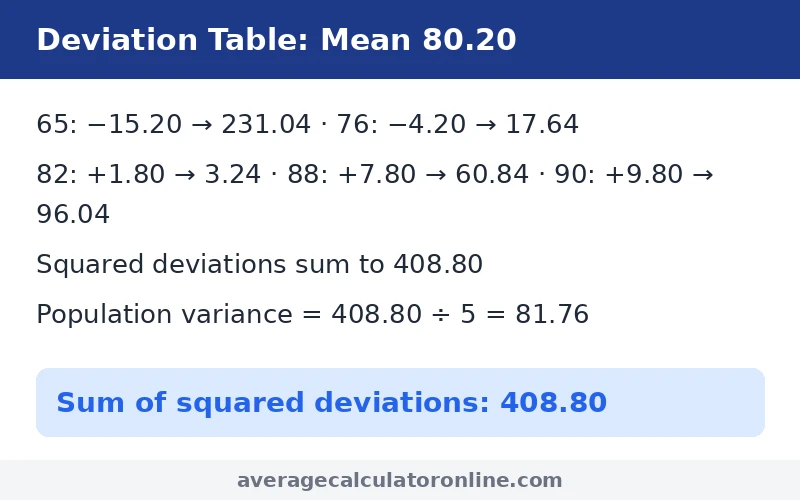
- Population formulas divide by n (the full count). Use them when your numbers are the entire group you care about — for example, all five quiz scores in a class of five. Population variance = 408.80 ÷ 5 = 81.76; population standard deviation = √81.76 = 9.04.
- Sample formulas divide by n − 1 (Bessel’s correction). Use them when your numbers are a sample taken from a larger group, and you are estimating the spread of the whole group — for example, five students surveyed out of a school of five hundred. Sample variance = 408.80 ÷ 4 = 102.20; sample standard deviation = √102.20 = 10.11.
The sample figures are always a little larger than the population figures for the same data, because dividing by the smaller n − 1 inflates the result. For a single calculation rather than a whole dataset, the math calculator handles the basic operations, and if the numbers are test scores, the grade calculator turns them into a percentage and a letter grade. The mean, median, mode and range are identical either way — only variance and standard deviation change. If you are not sure which one you need, check what your teacher, textbook or assignment asks for: school statistics problems usually say “population” or “sample” explicitly.
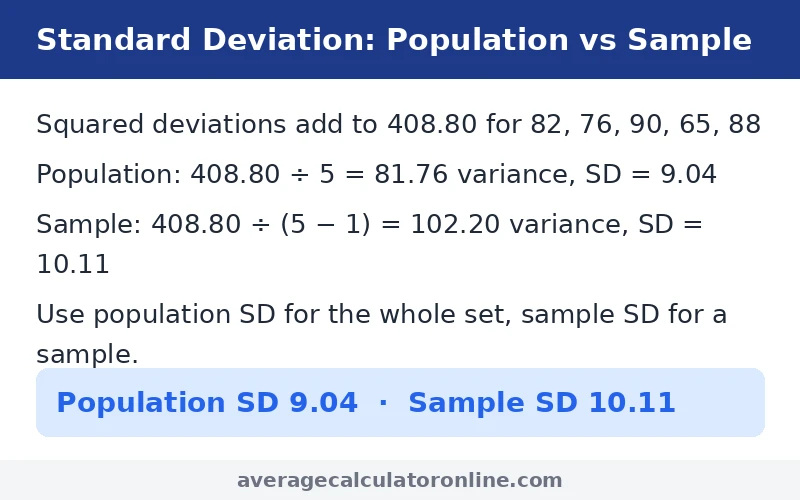
Step-by-step deviation table (default dataset, recomputed)
The variance and standard deviation come from this table. Mean = 80.20.
| Value | Value − Mean | (Value − Mean)² |
|---|---|---|
| 65 | −15.20 | 231.04 |
| 76 | −4.20 | 17.64 |
| 82 | +1.80 | 3.24 |
| 88 | +7.80 | 60.84 |
| 90 | +9.80 | 96.04 |
| Sum | 0.00 | 408.80 |
The deviations always add to 0.00 — a useful check that the mean is right. Then: population variance = 408.80 ÷ 5 = 81.76, population SD = √81.76 = 9.04; sample variance = 408.80 ÷ 4 = 102.20, sample SD = √102.20 = 10.11.
Population vs sample at a glance
| Divisor | Variance | Standard deviation | Use when | |
|---|---|---|---|---|
| Population | n (5) | 81.76 | 9.04 | Data is the whole group |
| Sample | n − 1 (4) | 102.20 | 10.11 | Data is a sample of a larger group |
Worked examples
Example 1 — The default dataset: mean 80.20, median 82
Dataset 82, 76, 90, 65, 88.
- Sorted: 65, 76, 82, 88, 90
- Sum: 82 + 76 + 90 + 65 + 88 = 401
- Mean: 401 ÷ 5 = 80.20
- Median: middle value = 82
- Mode: no value repeats → no mode
- Range: 90 − 65 = 25
- Squared deviations sum to 408.80
- Population variance: 408.80 ÷ 5 = 81.76; population SD = 9.04
- Sample variance: 408.80 ÷ 4 = 102.20; sample SD = 10.11
Example 2 — Three test scores: 70, 80, 90
- Sum: 70 + 80 + 90 = 240
- Mean: 240 ÷ 3 = 80.00
- Median: middle of 70, 80, 90 = 80.00
- Range: 90 − 70 = 20
- Squared deviations: (−10)² + 0² + 10² = 100 + 0 + 100 = 200
- Population variance: 200 ÷ 3 = 66.67; population SD = 8.16
- Sample variance: 200 ÷ 2 = 100.00; sample SD = 10.00
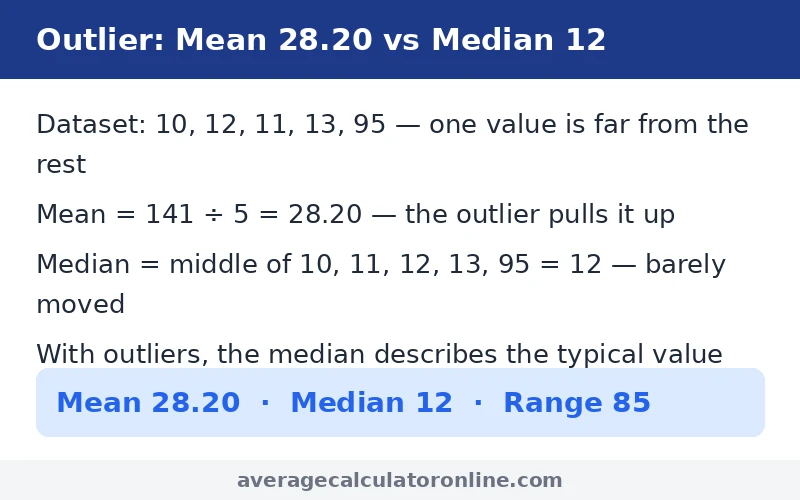
Example 3 — One outlier changes the mean, not the median: 10, 12, 11, 13, 95
- Sorted: 10, 11, 12, 13, 95
- Sum: 10 + 12 + 11 + 13 + 95 = 141
- Mean: 141 ÷ 5 = 28.20 — the single value 95 pulls the mean far above the other four values
- Median: middle value = 12 — barely moved by the outlier
- Range: 95 − 10 = 85
- Population variance: 1,116.56; population SD = 33.41
- Sample variance: 1,395.70; sample SD = 37.36
This is why the median is the better “typical value” when a dataset has outliers: the mean of 28.20 describes none of the five numbers well, while the median of 12 sits right in the middle of the four ordinary values.
Example 4 — Finding the mode: 3, 5, 5, 7, 9
- Sum: 3 + 5 + 5 + 7 + 9 = 29
- Mean: 29 ÷ 5 = 5.80
- Median: middle of 3, 5, 5, 7, 9 = 5
- Mode: 5 (appears twice; every other value appears once)
- Range: 9 − 3 = 6
- Population variance: 4.16; population SD = 2.04
- Sample variance: 5.20; sample SD = 2.28
Tips and mistakes
- Do not mix up population and sample standard deviation. They are different numbers for the same data (9.04 vs 10.11 here). Check whether your data is the whole group or a sample, and label which one you are reporting — the tool shows both so you can pick the right one.
- Sort before finding the median. The median is the middle of the sorted list. Taking the middle of the unsorted list gives a wrong answer whenever the numbers are not already in order.
- With an even count, average the two middle values. For 4, 8, 15, 16, 23, 42 the median is (15 + 16) ÷ 2 = 15.50 — not 15 and not 16.
- The mean is sensitive to outliers; the median is not. One value of 95 among 10, 11, 12, 13 moves the mean from 11.50 to 28.20 but leaves the median at 12. Report the median alongside the mean when outliers are present.
- Variance is in squared units. A variance of 81.76 is not “81.76 points” — it is points squared. Take the square root (standard deviation, 9.04) when you want a spread figure in the original units.
- “No mode” is a valid answer. If no value repeats, the dataset has no mode. Do not force the most common value when every value appears exactly once.
- Check that your deviations sum to zero. If the (value − mean) column does not add to 0.00, the mean is wrong — it is a quick self-check before trusting the variance.
Sources
Mean, median and standard deviation follow standard definitions — see Mean and Standard Deviation on MathWorld. Reviewed by the Average Calculator Team. Last reviewed: 7 November 2026.
FAQs
How do you calculate the mean?
Add all the values together and divide by how many there are: Mean = Sum ÷ Count. For 82, 76, 90, 65, 88 the sum is 401 and the count is 5, so the mean is 401 ÷ 5 = 80.20. The same mean calculation powers our Average Calculator.
What is the difference between population and sample standard deviation?
Population standard deviation divides the sum of squared deviations by n (the full count) and is used when your data is the entire group. Sample standard deviation divides by n − 1 and is used when your data is a sample estimating a larger group. For 82, 76, 90, 65, 88 the population standard deviation is 9.04 and the sample standard deviation is 10.11.
How do you find the median with an even number of values?
Sort the numbers, take the two middle values, and average them. For 4, 8, 15, 16, 23, 42 the two middle values are 15 and 16, so the median is (15 + 16) ÷ 2 = 15.50.
What is the mode, and can a dataset have no mode?
The mode is the value that appears most often. For 3, 5, 5, 7, 9 the mode is 5. A dataset can have more than one mode, or no mode at all — if no value repeats, as in 82, 76, 90, 65, 88, there is no mode.
Should I use the mean or the median?
Use the mean when the values are roughly symmetric with no extreme values, because it uses every number. Use the median when there are outliers, because one extreme value can drag the mean away from the typical value — in 10, 12, 11, 13, 95 the mean is 28.20 but the median is 12, and 12 describes the typical value far better.
Sports averages work the same way — see our Cricket Average Calculator for batting and bowling averages.
How do you calculate variance and standard deviation?
First find the mean, then subtract it from each value, square each difference, and add the squares. Divide that sum by n for population variance or by n − 1 for sample variance, then take the square root for the standard deviation. For 82, 76, 90, 65, 88 the squared deviations sum to 408.80, giving a population variance of 81.76 (SD 9.04) and a sample variance of 102.20 (SD 10.11).
Disclaimer
The figures on this page are descriptive statistics computed from the numbers you enter. They describe your dataset only — they do not predict future results, and they are not financial, medical or legal advice. Population and sample standard deviations are different measures: make sure you report the one your assignment or analysis asks for. If you are using statistics for a graded assignment, check your course’s required formulas first.
Related calculators
- Average Calculator Online — the homepage average tool
- Grade Calculator — class grades and averages
- Percentage Calculator — percentage change and proportions
- Scientific Calculator — square roots and powers for hand-checking standard deviation
- Final Grade Calculator — what you need on a final exam to reach a target grade
Last updated: November 7, 2026.