Average vs Mean Explained: Are They the Same Thing?
Short answer: in everyday use, yes — “average” almost always means the arithmetic mean. When someone says “the average test score is 86.6” or “the average temperature this week was 20 degrees,” they added the numbers up and divided by how many there were. That is the arithmetic mean. But “average” is also a broader word: statisticians use it as an umbrella term for the mean, the median and the mode, each answering a slightly different question — and on skewed data they can disagree by a lot.
This guide explains the difference in plain language, works through real examples with every step shown, and compares the mean with the median, mode, geometric mean and harmonic mean.
What Is the Mean?
The arithmetic mean is the sum of all the values divided by the number of values. It is the most common way to describe the centre of a set of numbers, and it is the calculation behind most averages you meet in daily life: average grades, average speeds, average monthly spending, and average ratings.
Mean = (sum of all values) ÷ (number of values)
The mean uses every value, which is both its strength and its weakness: it reflects the whole set, but a single extreme value can drag it far from where most numbers sit. The examples below show it behaving well — and then being misled by one outlier.
Worked Example 1: The Basic Average of 10, 20 and 30
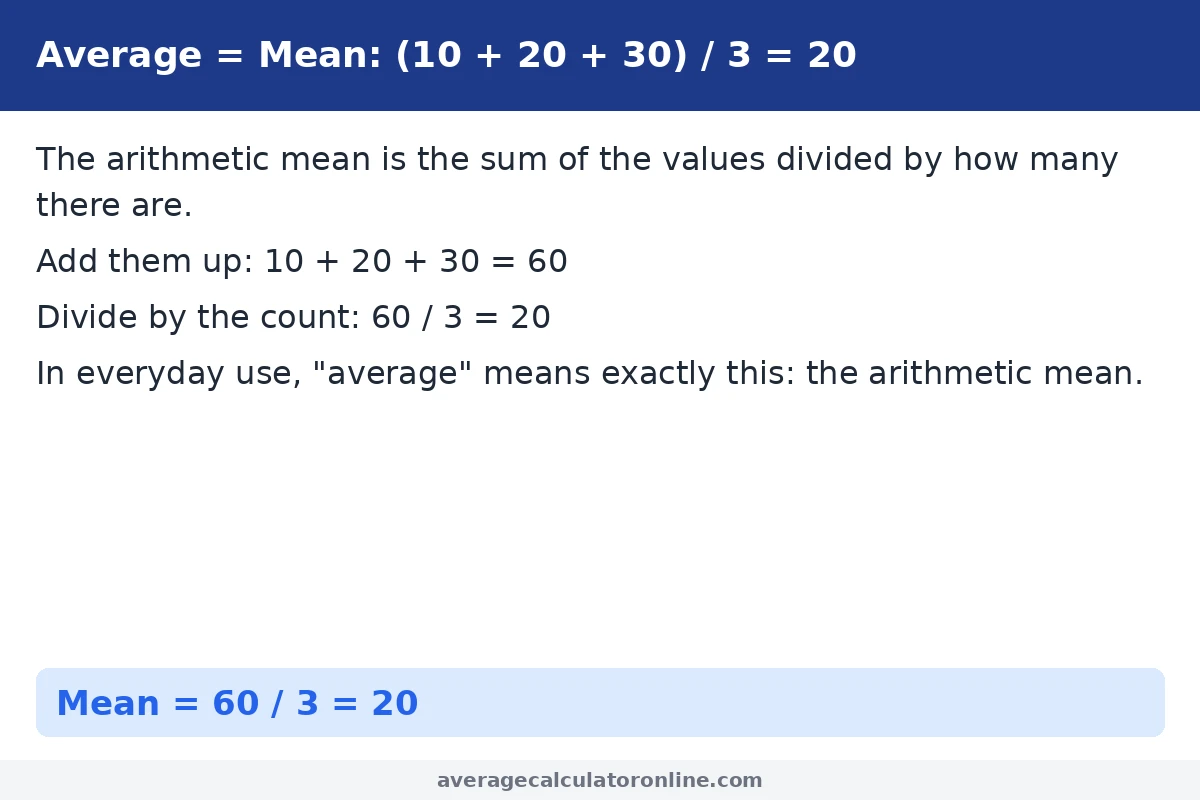
Take three simple numbers: 10, 20 and 30. To find their average, add them and divide by 3.
Step 1 — Add: 10 + 20 + 30 = 60.
Step 2 — Count: there are 3 values.
Step 3 — Divide: 60 ÷ 3 = 20.
The average (mean) is 20. Note that 20 is also the middle value here — a coincidence of this evenly spaced set. Check the result with our Average Calculator: enter 10, 20 and 30 and it returns 20.
Worked Example 2: Five Test Scores — Mean, Median, Range and Geometric Mean
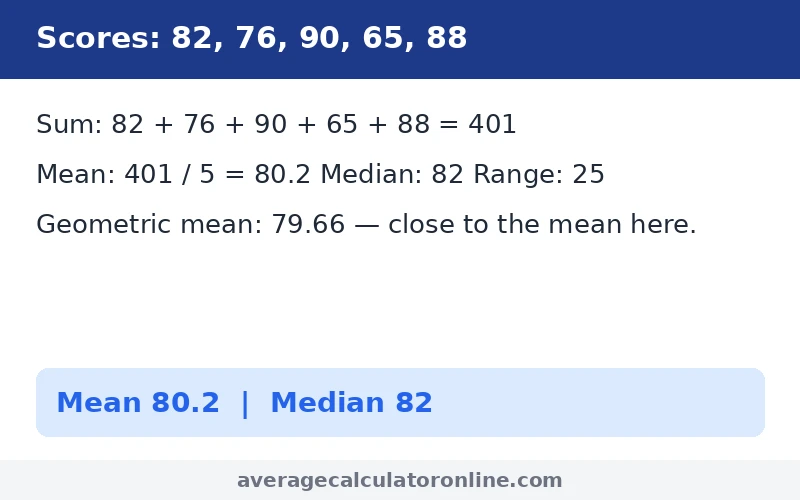
Now a realistic set of test scores: 82, 76, 90, 65 and 88. Here the different “averages” start to separate, which is exactly the point of this article.
Step 1 — Add: 82 + 76 + 90 + 65 + 88 = 401.
Step 2 — Divide by 5: 401 ÷ 5 = 80.2. The mean is 80.2.
Step 3 — Median: sort the scores (65, 76, 82, 88, 90) and take the middle one. The median is 82.
Step 4 — Range: highest minus lowest, 90 − 65 = 25.
The mean (80.2) and the median (82) are close, which tells you the scores are fairly balanced — no single score dominates. The geometric mean is 79.66, again close. When all the measures of centre agree, you can trust the average; when they disagree, the next example shows what that looks like.
If you want to repeat this kind of analysis, the Statistics Calculator computes the mean, median, mode, range and more from any list of numbers in one step.
Worked Example 3: When the Mean Misleads — The Outlier Problem
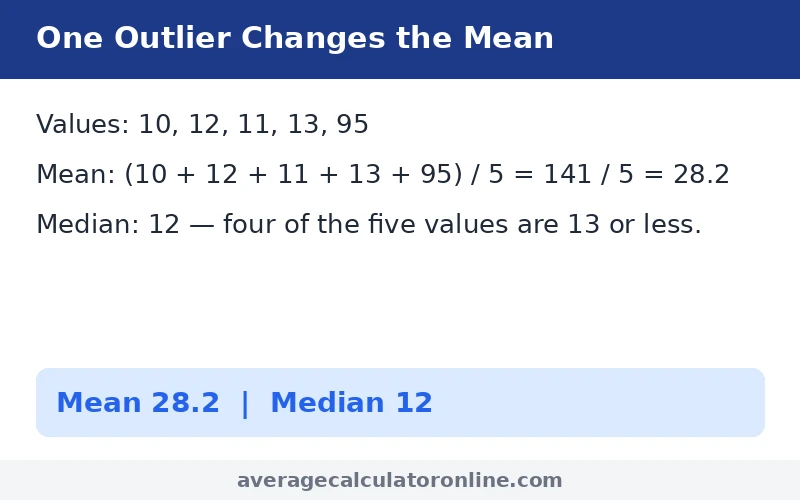
Consider the set 10, 12, 11, 13 and 95. Four values sit between 10 and 13, and one value, 95, is far away from the rest.
Step 1 — Add: 10 + 12 + 11 + 13 + 95 = 141.
Step 2 — Divide by 5: 141 ÷ 5 = 28.2. The mean is 28.2.
Step 3 — Median: sort the values (10, 11, 12, 13, 95) and take the middle one. The median is 12.
The mean says the “average” is 28.2, yet none of the five values is near 28.2 — four are 13 or less. The median of 12 describes the typical value far better. Income is the famous real-world case: a few very high salaries lift the mean income of a town well above what a typical resident earns, which is why median income is usually the more honest figure.
The same lesson appears in the set 2, 7, 19, 24 and 25: its mean is 15.4, but its median is 19, because the small values 2 and 7 drag the mean down. Whenever the mean and median differ, ask which values are pulling before quoting either one.
Mean vs Median vs Mode vs Geometric vs Harmonic: Comparison Table
| Measure | Definition | When to use it | Weakness |
|---|---|---|---|
| Arithmetic mean | Sum of values divided by count | Everyday averages: grades, temperatures, spending | Misled by outliers; meaningless for skewed data |
| Median | Middle value when sorted | Income, house prices, any skewed data | Ignores how far values are from the centre |
| Mode | Most frequent value | Categories, sizes, survey answers | May not exist, or there may be several |
| Geometric mean | nth root of the product of n values | Growth rates, ratios, investment returns | Cannot handle zero or negative values |
| Harmonic mean | Count divided by the sum of reciprocals | Average speeds, rates, price-to-earnings ratios | Very sensitive to small values near zero |
There is no single best “average.” The arithmetic mean is the default, the median is the honest choice for skewed data, the mode is the only option for categories, and the geometric and harmonic means cover multiplication and rates. When the mean and median disagree, report both — the gap itself tells you about the shape of your data.
Geometric Mean and Harmonic Mean in One Example
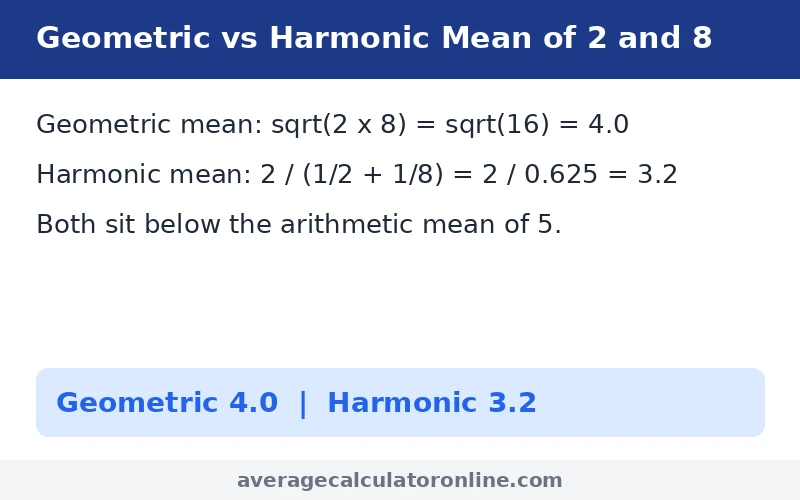
For the numbers 2 and 8, the three means give three different answers, which shows how much the choice of formula matters.
Arithmetic mean: (2 + 8) ÷ 2 = 5.
Geometric mean: √(2 × 8) = √16 = 4.0.
Harmonic mean: 2 ÷ (1/2 + 1/8) = 2 ÷ 0.625 = 3.2.
The geometric mean is the right tool for growth: if an investment doubles one year and halves the next, it captures the true average growth, while the arithmetic mean overstates it. The harmonic mean is the right tool for rates, such as driving the same distance at two different speeds. For ordinary lists of scores, though, the arithmetic mean is what people mean by “average.”
Common Mistakes When Working With Averages
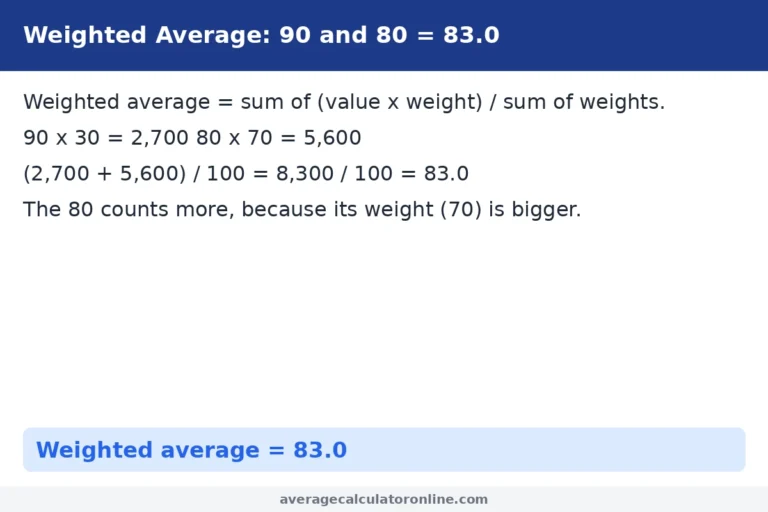
Averaging averages without weights. If one class of 10 students averages 90 and another class of 40 averages 80, the overall average is not (90 + 80) ÷ 2 = 85 — the bigger class counts more, so the correct answer is a weighted average. Whenever the groups differ in size, weight by size.
Letting one outlier dominate. As the 95 example showed, a single extreme value can move the mean far from the typical value. Before reporting a mean, glance at the median: if the two are far apart, report both and explain why.
Confusing the mean with “typical.” The mean is a balance point, not necessarily a value anyone actually has: in the outlier set, nobody scored 28.2 — the typical score was 12.
Forgetting what was included. An average is only as honest as its data. Dropping the lowest score, excluding a bad month, or silently removing an outlier changes the result. Always say what went into the average.
How to Calculate an Average in Excel and Google Sheets
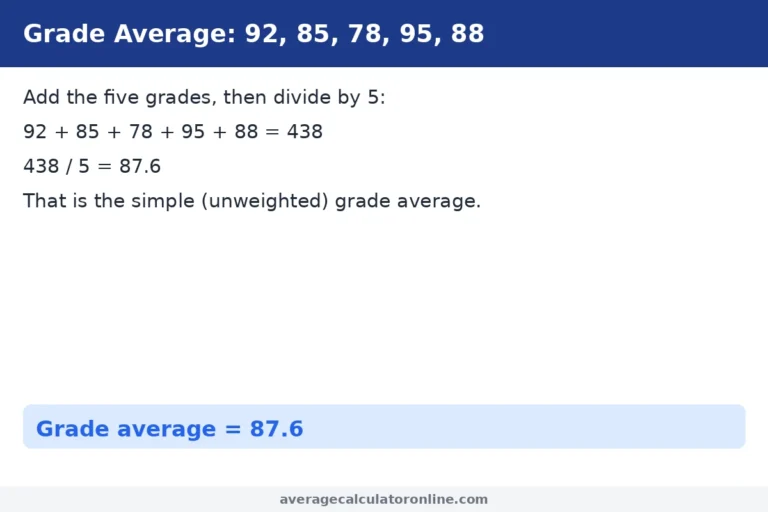
In Excel or Google Sheets, type your numbers into cells A1 to A5 and use =AVERAGE(A1:A5). For the test scores 78, 85, 92, 88 and 90, that returns 86.6 (433 ÷ 5). The median is =MEDIAN(A1:A5) and the mode is =MODE(A1:A5). If you need a percentage change on an average, the Percentage Calculator handles it — and when some values should count more than others, use the Weighted Average Calculator instead.
Try it: enter your own numbers in the Average Calculator and compare the mean, median and mode side by side before you quote an average.
Frequently Asked Questions
Is average the same as mean?
In everyday use, yes. When people say “average,” they almost always mean the arithmetic mean: add the values and divide by how many there are. In statistics, “average” is a broader term that can also mean the median or the mode.
What is the average of 10, 20 and 30?
The average of 10, 20 and 30 is 20. Add them to get 60, then divide by 3: 60 ÷ 3 = 20.
When should I use the median instead of the mean?
Use the median when your data has outliers or is skewed, such as income or house prices. In the set 10, 12, 11, 13 and 95, the mean is 28.2 but the median is 12, and the median describes the typical value far better.
What is the difference between mean, median and mode?
The mean is the sum divided by the count, the median is the middle value when the data is sorted, and the mode is the most frequent value. For the scores 82, 76, 90, 65 and 88, the mean is 80.2 and the median is 82.
Can the mean and the median be different?
Yes. In the set 2, 7, 19, 24 and 25, the mean is 15.4 while the median is 19, because the small values 2 and 7 pull the mean down. A gap between the mean and the median is a sign of skewed data.
How do I find a missing number from an average?
Multiply the average by the count to get the total, then subtract the numbers you know. If the average of 5 numbers is 18, the total is 90. If the known numbers are 12, 16, 20 and 24 (total 72), the missing number is 90 − 72 = 18.
Related calculators: Average Calculator · Statistics Calculator · Percentage Calculator · Weighted Average Calculator