Running Average Explained: Cumulative, Moving & Exponential
Short answer: A running average is an average that updates as each new value arrives, instead of being calculated once at the end. There are three common kinds: the cumulative average, which averages everything seen so far; the simple moving average (SMA), which averages only the most recent values inside a fixed window; and the exponential moving average (EMA), which gives recent values more weight through a smoothing factor called alpha.
Running averages show up everywhere once you know to look for them: a shop tracking daily sales, a weather app showing the temperature trend, a stock chart smoothing out daily jumps, or a fitness app showing your average pace over recent runs. A single overall average hides all of that movement. A running average keeps it visible. This guide explains all three methods with the same worked example, so you can compare them directly — and the Running Average Calculator on this site computes all three for any numbers you enter.
Method 1: Cumulative Running Average
The cumulative running average is the simplest kind. After each new value arrives, you average everything you have seen so far. The formula after the nth value is:
Cumulative average = (sum of all values so far) / (number of values so far)
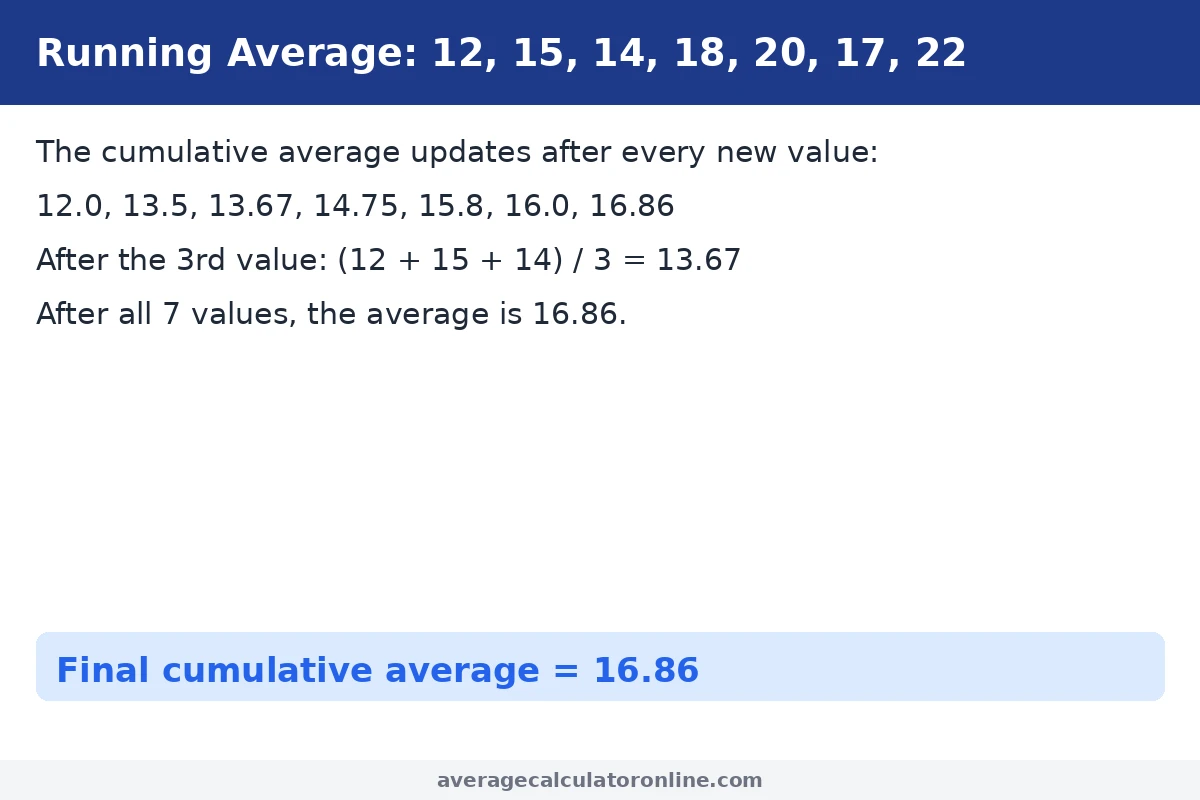
Take the sequence 12, 15, 14, 18, 20, 17, 22. The running averages after each value are:
| Step | New value | Values so far | Running average |
|---|---|---|---|
| 1 | 12 | 12 | 12.0 |
| 2 | 15 | 12, 15 | 13.5 |
| 3 | 14 | 12, 15, 14 | 13.67 |
| 4 | 18 | 12, 15, 14, 18 | 14.75 |
| 5 | 20 | 12, 15, 14, 18, 20 | 15.8 |
| 6 | 17 | 12, 15, 14, 18, 20, 17 | 16.0 |
| 7 | 22 | 12, 15, 14, 18, 20, 17, 22 | 16.86 |
Check the third step by hand: (12 + 15 + 14) / 3 = 41 / 3 = 13.67. And the final step: (12 + 15 + 14 + 18 + 20 + 17 + 22) / 7 = 118 / 7 = 16.86.
The cumulative average uses all the data, so it is stable — but as more values accumulate, each new value matters less. It records “how have we done overall so far” well, and spots recent change poorly.
Method 2: Simple Moving Average (SMA)
A simple moving average looks at only the most recent values — a fixed-size window that slides forward as new data arrives. Older values drop out of the window entirely. The formula for a window of size k is:
SMA = (sum of the last k values) / k
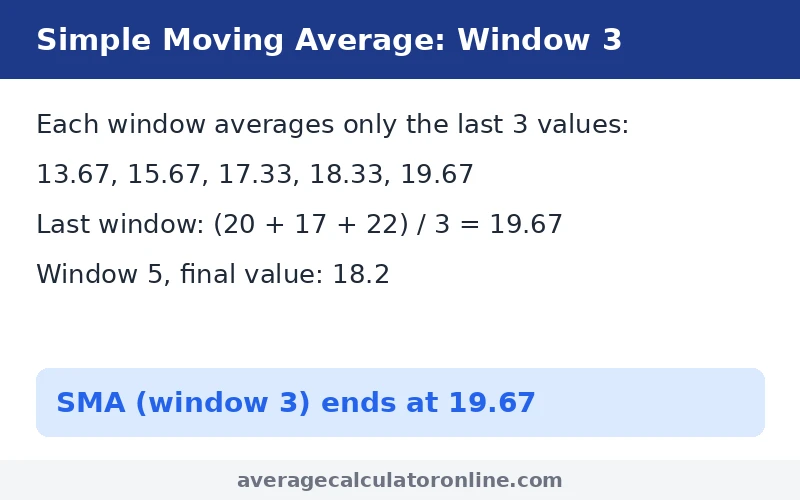
Using the same sequence (12, 15, 14, 18, 20, 17, 22) with a window of 3, the moving averages are:
| Window | Values in window | SMA (window 3) |
|---|---|---|
| 1 | 12, 15, 14 | 13.67 |
| 2 | 15, 14, 18 | 15.67 |
| 3 | 14, 18, 20 | 17.33 |
| 4 | 18, 20, 17 | 18.33 |
| 5 | 20, 17, 22 | 19.67 |
Check the last window: (20 + 17 + 22) / 3 = 59 / 3 = 19.67. With a wider window of 5, the final value is different: (14 + 18 + 20 + 17 + 22) / 5 = 91 / 5 = 18.2.
Notice how the window-3 SMA (19.67) sits well above the cumulative average (16.86) at the end: the SMA has forgotten the low early values — 12, 15, 14 — and only sees the recent, higher ones.
Method 3: Exponential Moving Average (EMA)
The exponential moving average is a middle ground. Unlike the SMA, it never fully forgets old values — but it gives them less and less weight as they get older. Each new value updates the EMA with a smoothing factor called alpha (α), a number between 0 and 1:
EMA = alpha × new value + (1 − alpha) × previous EMA
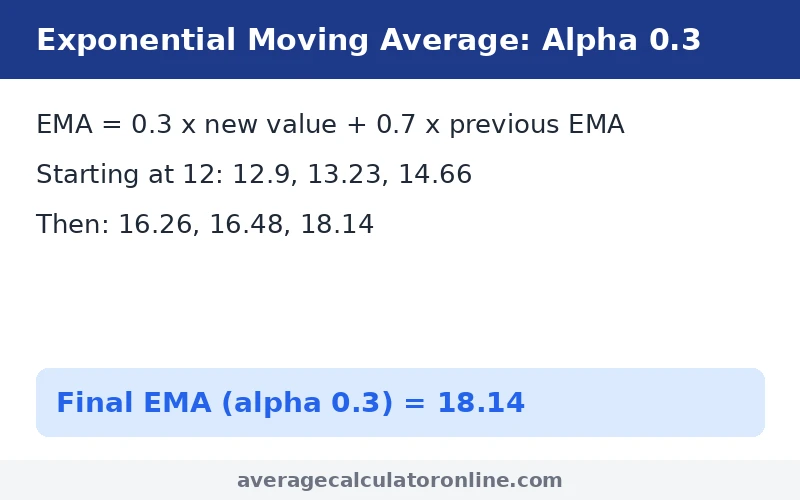
With alpha = 0.3 and starting from the first value, 12, the same sequence gives:
| Step | New value | Calculation | EMA (alpha 0.3) |
|---|---|---|---|
| 1 | 12 | starting value | 12 |
| 2 | 15 | 0.3 × 15 + 0.7 × 12 | 12.9 |
| 3 | 14 | 0.3 × 14 + 0.7 × 12.9 | 13.23 |
| 4 | 18 | 0.3 × 18 + 0.7 × 13.23 | 14.66 |
| 5 | 20 | 0.3 × 20 + 0.7 × 14.66 | 16.26 |
| 6 | 17 | 0.3 × 17 + 0.7 × 16.26 | 16.48 |
| 7 | 22 | 0.3 × 22 + 0.7 × 16.48 | 18.14 |
The final EMA is 18.14 — between the cumulative average (16.86) and the window-3 SMA (19.67). The EMA reacts faster than the cumulative average, but stays smoother than a short-window SMA because it never drops old values abruptly.
Alpha controls the balance. A larger alpha (say, 0.5) gives new values more weight, so the EMA follows changes quickly but jumps around more. A smaller alpha (say, 0.1) makes it slow and smooth. Always state the alpha you used, so someone else can reproduce your numbers.
Comparison: Which Method Should You Use?
| Method | Reacts how fast | Best for |
|---|---|---|
| Cumulative average | Slow — new values matter less over time | Overall performance so far |
| Simple moving average (SMA) | Depends on window: small window reacts fast, large window reacts slowly | Recent trends |
| Exponential moving average (EMA) | Fast, controlled by alpha | Data where recent values matter most |
A rule: if you want the full picture, use the cumulative average. If you want to know what is happening now, use a moving average — SMA if you want an explainable window, EMA if you want a response that never jumps when a value leaves the window.
Real Uses
Daily sales
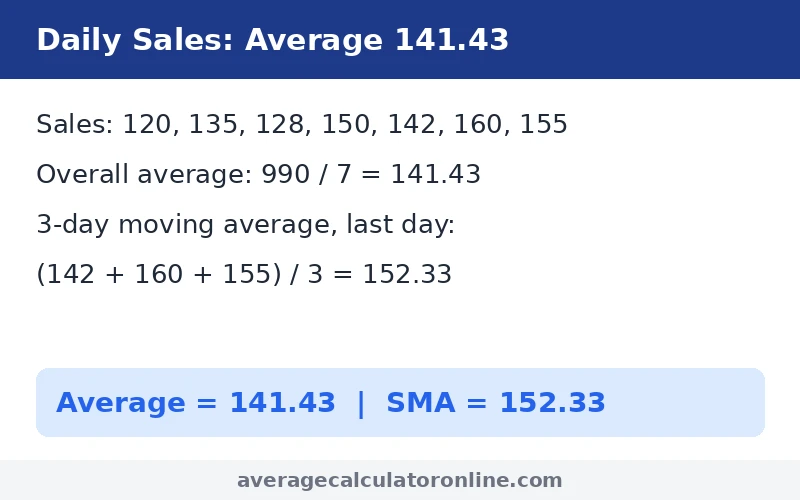
A small shop records seven days of sales: 120, 135, 128, 150, 142, 160, 155. The overall average is (120 + 135 + 128 + 150 + 142 + 160 + 155) / 7 = 990 / 7 = 141.43. But the 3-day moving average on the last day is (142 + 160 + 155) / 3 = 457 / 3 = 152.33 — well above the overall average.
Temperature trends
A week of daily high temperatures: 21, 22, 20, 23, 24, 22, 25 (°C). The 3-day moving average on day 7 is (24 + 22 + 25) / 3 = 71 / 3 = 23.67, and the cumulative average for the week is 157 / 7 = 22.43. The moving average tells you the recent days have been warmer than the week as a whole.
Stock prices
Stock charts almost always show moving averages — commonly 50-day and 200-day SMAs. A price crossing above its moving average is often read as upward momentum, and crossing below as weakness.
Fitness tracking
Runners track a moving average of pace or weekly distance rather than judging themselves on one run. A 4-week moving average smooths out a rest week or a single long run. The same logic applies to weight tracking: a 7-day moving average of daily weigh-ins beats any single morning’s number.
Common Mistakes
Window too small = noisy. A 2-day moving average jumps almost as much as the raw data. If the average swings wildly from day to day, widen the window.
Window too large = lags. A 30-day moving average will still show last month’s level long after conditions have changed. If the average never catches up with reality, narrow the window.
EMA alpha confusion. Alpha is not a window size, and a larger alpha does not mean “more smoothing” — it means the opposite: new values get more weight, so the EMA reacts faster and is noisier. Always note the alpha alongside the result.
Mixing methods without saying so. A cumulative average, an SMA, and an EMA on the same data give different numbers — 16.86, 19.67, and 18.14 in this guide’s example. Always say which method and which window or alpha you used.
Forgetting the first values. A window-3 SMA has no value for the first two data points, because there are not three values yet. Some tools fill those gaps with shorter windows; others leave them blank.
Try It
Enter your own numbers in the Running Average Calculator to get the cumulative average, SMA, and EMA side by side, or use the Statistics Calculator for the mean, median, and standard deviation of a full data set.
Frequently Asked Questions
What is a running average?
A running average is an average that updates as each new value arrives, instead of being calculated once at the end. The three common kinds are the cumulative average (all values so far), the simple moving average (only the last few values in a fixed window), and the exponential moving average (all values, with recent ones weighted more).
How do you calculate a cumulative running average?
After each new value, add up all values so far and divide by how many there are. For the sequence 12, 15, 14, 18, 20, 17, 22, the running averages are 12.0, 13.5, 13.67, 14.75, 15.8, 16.0, and 16.86.
What is a simple moving average (SMA)?
An SMA averages only the most recent values inside a fixed window. With a window of 3 on the sequence 12, 15, 14, 18, 20, 17, 22, the windows give 13.67, 15.67, 17.33, 18.33, and 19.67. A wider window of 5 gives a final value of 18.2.
What is an exponential moving average (EMA)?
An EMA updates with the formula EMA = alpha × new value + (1 − alpha) × previous EMA, where alpha is a smoothing factor between 0 and 1. With alpha 0.3 starting at 12, the sequence 12, 15, 14, 18, 20, 17, 22 gives a final EMA of 18.14. A larger alpha reacts faster; a smaller alpha is smoother.
Which is better: SMA or EMA?
Neither is better in general. An SMA is easier to explain because it uses a plain window of recent values, but it jumps when a value leaves the window. An EMA reacts smoothly and never drops values abruptly, but its alpha needs to be stated for the result to be reproducible. Use the SMA for a clean recent trend and the EMA when recent values should matter most.
What window size should I use for a moving average?
It depends on your data and your question. A 3-day window follows daily sales closely but stays noisy; a 7-day window smooths out the day-of-week pattern; a 30-day window shows the monthly trend but lags behind change. If the average swings wildly, widen the window; if it never catches up with reality, narrow it.
Related calculators: Running Average Calculator (planned tool — verify live before publishing) · Statistics Calculator · Average Calculator · Math Calculator